10 Dynamic UI
So far, we’ve seen a clean separation between the user interface and the server function: the user interface is defined statically when the app is launched so it can’t respond to anything that happens in the app. In this chapter, you’ll learn how to create dynamic user interfaces, changing the UI using code run in the server function.
There are three key techniques for creating dynamic user interfaces:
Using the
updatefamily of functions to modify parameters of input controls.Using
tabsetPanel()to conditionally show and hide parts of the user interface.Using
uiOutput()andrenderUI()to generate selected parts of the user interface with code.
These three tools give you considerable power to respond to the user by modifying inputs and outputs. I’ll demonstrate some of the more useful ways in which you can apply them, but ultimately you’re only constrained by your creativity. At the same time, these tools can make your app substantially more difficult to reason about, so deploy them sparingly, and always strive to use the simplest technique that solves your problem.
10.1 Updating inputs
We’ll begin with a simple technique that allows you to modify an input after it has been created: the update family of functions.
Every input control, e.g. textInput(), is paired with an update function, e.g. updateTextInput(), that allows you to modify the control after it has been created.
Take the example in the code below, with the results shown in Figure 10.1.
The app has two inputs that control the range (the min and max) of another input, a slider.
The key idea is to use observeEvent()32 to trigger updateSliderInput() whenever the min or max inputs change.
ui <- fluidPage(
  numericInput("min", "Minimum", 0),
  numericInput("max", "Maximum", 3),
  sliderInput("n", "n", min = 0, max = 3, value = 1)
)
server <- function(input, output, session) {
  observeEvent(input$min, {
    updateSliderInput(inputId = "n", min = input$min)
  })
  observeEvent(input$max, {
    updateSliderInput(inputId = "n", max = input$max)
  })
}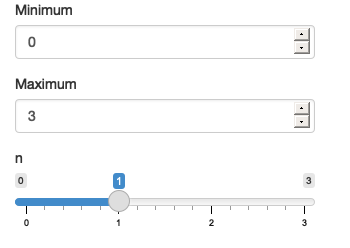
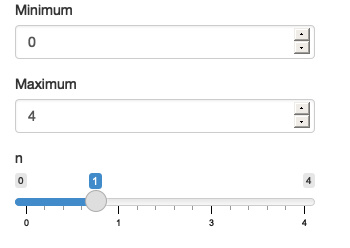
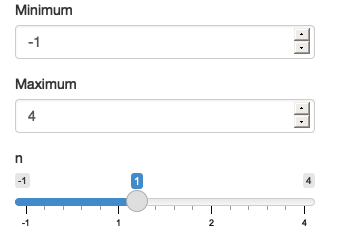
Figure 10.1: The app on load (left), after increasing max (middle), and then decreasing min (right). See live at https://hadley.shinyapps.io/ms-update-basics.
The update functions look a little different to other Shiny functions: they all take name of the input (as a string) as the the inputId argument33.
The remaining arguments correspond to the arguments to the input constructor that can be modified after creation.
To help you get the hang of the update functions, I’ll show a couple more simple examples, then we’ll dive into a more complicated case study using hierarchical select boxes, and finish off by discussing the problem of circular references.
10.1.1 Simple uses
The simplest uses of the update functions are to provide small conveniences for the user.
For example, maybe you want to make it easy to reset parameters back to their initial value.
The following snippet shows how you might combine an actionButton(), observeEvent() and updateSliderInput(), with the output shown in Figure 10.2.
ui <- fluidPage(
  sliderInput("x1", "x1", 0, min = -10, max = 10),
  sliderInput("x2", "x2", 0, min = -10, max = 10),
  sliderInput("x3", "x3", 0, min = -10, max = 10),
  actionButton("reset", "Reset")
)

server <- function(input, output, session) {
  observeEvent(input$reset, {
    updateSliderInput(inputId = "x1", value = 0)
    updateSliderInput(inputId = "x2", value = 0)
    updateSliderInput(inputId = "x3", value = 0)
  })
}
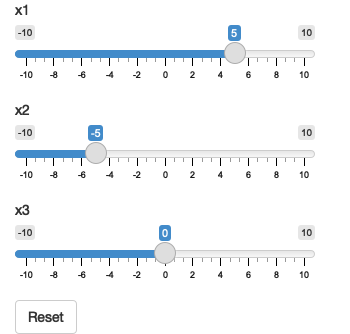
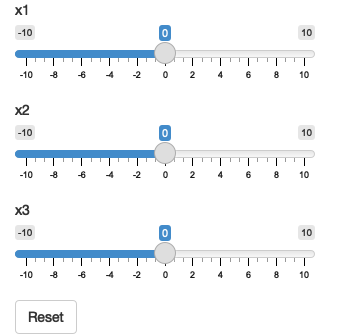
Figure 10.2: The app on load (left), after dragging some sliders (middle), then clicking reset (right). See live at https://hadley.shinyapps.io/ms-update-reset.
A similar application is to tweak the text of an action button so you know exactly what it’s going to do. Figure 10.3 shows the results of the code below.
ui <- fluidPage(
  numericInput("n", "Simulations", 10),
  actionButton("simulate", "Simulate")
)

server <- function(input, output, session) {
  observeEvent(input$n, {
    label <- paste0("Simulate ", input$n, " times")
    updateActionButton(inputId = "simulate", label = label)
  })
}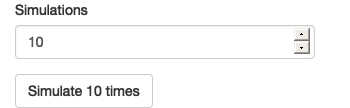
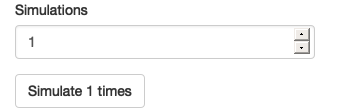
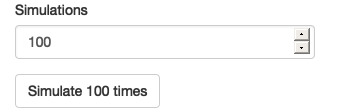
Figure 10.3: The app on load (left), after setting simulations to 1 (middle), then setting simulations to 100 (right). See live at https://hadley.shinyapps.io/ms-update-button.
There are many ways to use update functions in this way; be on the look out for ways to give more information to the user when you are working on sophisticated applications. A particularly important application is making it easier to select from a long list of possible options, through step-by-step filtering. That’s often a problem for “hierarchical select boxes”.
10.1.2 Hierarchical select boxes
A more complicated, but particularly useful, application of the update functions is to allow interactive drill down across multiple categories. I’ll illustrate their usage with some imaginary data for a sales dashboard that comes from https://www.kaggle.com/kyanyoga/sample-sales-data.
sales <- vroom::vroom("sales-dashboard/sales_data_sample.csv", col_types = list(), na = "")
sales %>%
select(TERRITORY, CUSTOMERNAME, ORDERNUMBER, everything()) %>%
arrange(ORDERNUMBER)
#> # A tibble: 2,823 × 25
#> TERRITORY CUSTOM…¹ ORDER…² QUANT…³ PRICE…⁴ ORDER…⁵ SALES ORDER…⁶ STATUS QTR_ID
#> <chr> <chr> <dbl> <dbl> <dbl> <dbl> <dbl> <chr> <chr> <dbl>
#> 1 NA Online … 10100 30 100 3 5151 1/6/20… Shipp… 1
#> 2 NA Online … 10100 50 67.8 2 3390 1/6/20… Shipp… 1
#> 3 NA Online … 10100 22 86.5 4 1903. 1/6/20… Shipp… 1
#> 4 NA Online … 10100 49 34.5 1 1689. 1/6/20… Shipp… 1
#> 5 EMEA Blauer … 10101 25 100 4 3782 1/9/20… Shipp… 1
#> 6 EMEA Blauer … 10101 26 100 1 3773. 1/9/20… Shipp… 1
#> 7 EMEA Blauer … 10101 45 31.2 3 1404 1/9/20… Shipp… 1
#> 8 EMEA Blauer … 10101 46 53.8 2 2473. 1/9/20… Shipp… 1
#> 9 NA Vitachr… 10102 39 100 2 4808. 1/10/2… Shipp… 1
#> 10 NA Vitachr… 10102 41 50.1 1 2056. 1/10/2… Shipp… 1
#> # … with 2,813 more rows, 15 more variables: MONTH_ID <dbl>, YEAR_ID <dbl>,
#> # PRODUCTLINE <chr>, MSRP <dbl>, PRODUCTCODE <chr>, PHONE <chr>,
#> # ADDRESSLINE1 <chr>, ADDRESSLINE2 <chr>, CITY <chr>, STATE <chr>,
#> # POSTALCODE <chr>, COUNTRY <chr>, CONTACTLASTNAME <chr>,
#> # CONTACTFIRSTNAME <chr>, DEALSIZE <chr>, and abbreviated variable names
#> # ¹CUSTOMERNAME, ²ORDERNUMBER, ³QUANTITYORDERED, ⁴PRICEEACH, ⁵ORDERLINENUMBER,
#> # ⁶ORDERDATEFor this demo, I’m going to focus on a natural hierarchy in the data:
- Each territory contains customers.
- Each customer has multiple orders.
- Each order contains rows.
I want to create a user interface where you can:
- Select a territory to see all customers.
- Select a customer to see all orders.
- Select an order to see the underlying rows.
The essence of the UI is simple: I’ll create three select boxes and one output table.
The choices for the customername and ordernumber select boxes will be dynamically generated, so I set choices = NULL.
ui <- fluidPage(
  selectInput("territory", "Territory", choices = unique(sales$TERRITORY)),
  selectInput("customername", "Customer", choices = NULL),
  selectInput("ordernumber", "Order number", choices = NULL),
  tableOutput("data")
)
In the server function, I work top-down:
I create a reactive,
territory(), that contains the rows fromsalesthat match the selected territory.Whenever
territory()changes, I update the list ofchoicesin theinput$customernameselect box.I create another reactive,
customer(), that contains the rows fromterritory()that match the selected customer.Whenever
customer()changes, I update the list ofchoicesin theinput$ordernumberselect box.I display the selected orders in
output$data.
You can see that organisation below:
server <- function(input, output, session) {
  territory <- reactive({
    filter(sales, TERRITORY == input$territory)
  })
  observeEvent(territory(), {
    choices <- unique(territory()$CUSTOMERNAME)
    updateSelectInput(inputId = "customername", choices = choices)
  })

  customer <- reactive({
    req(input$customername)
    filter(territory(), CUSTOMERNAME == input$customername)
  })
  observeEvent(customer(), {
    choices <- unique(customer()$ORDERNUMBER)
    updateSelectInput(inputId = "ordernumber", choices = choices)
  })

  output$data <- renderTable({
    req(input$ordernumber)
    customer() %>%
      filter(ORDERNUMBER == input$ordernumber) %>%
      select(QUANTITYORDERED, PRICEEACH, PRODUCTCODE)
  })
}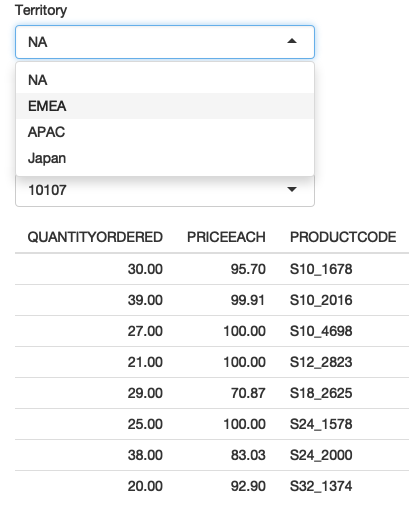
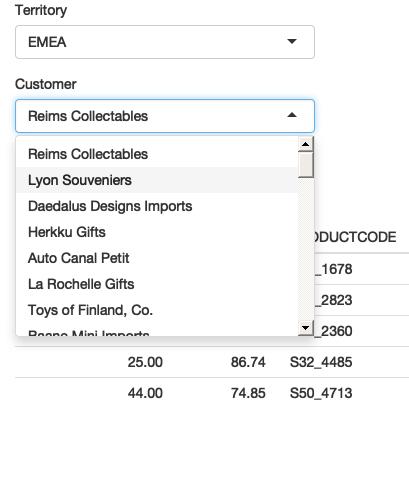
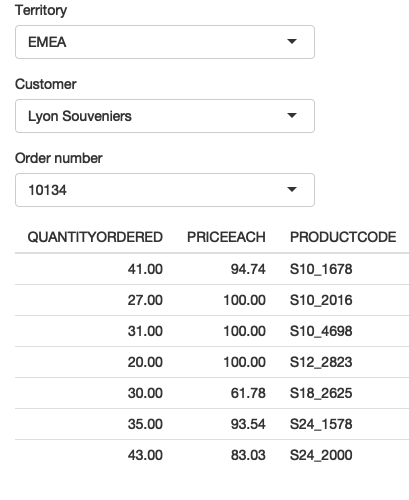
Figure 10.4: I select “EMEA” (left), then “Lyon Souveniers” (middle), then (right) look at the orders. See live at https://hadley.shinyapps.io/ms-update-nested.
Try out this simple example at https://hadley.shinyapps.io/ms-update-nested, or see a more fully fleshed out application at https://github.com/hadley/mastering-shiny/tree/master/sales-dashboard.
10.1.3 Freezing reactive inputs
Sometimes this sort of hierarchical selection can briefly create an invalid set of inputs, leading to a flicker of undesirable output. For example, consider this simple app where you select a dataset and then select a variable to summarise:
ui <- fluidPage(
  selectInput("dataset", "Choose a dataset", c("pressure", "cars")),
  selectInput("column", "Choose column", character(0)),
  verbatimTextOutput("summary")
)

server <- function(input, output, session) {
  dataset <- reactive(get(input$dataset, "package:datasets"))

  observeEvent(input$dataset, {
    updateSelectInput(inputId = "column", choices = names(dataset()))
  })

  output$summary <- renderPrint({
    summary(dataset()[[input$column]])
  })
}
If you try out the live app at https://hadley.shinyapps.io/ms-freeze, you’ll notice that when you switch datasets the summary output will briefly flicker.
That’s because updateSelectInput() only has an affect after all outputs and observers have run, so there’s temporarily a state where you have dataset B and a variable from dataset A, so that the output contains summary(NULL).
You can resolve this problem by “freezing” the input with freezeReactiveValue().
This ensures that any reactives or outputs that use the input won’t be updated until the next full round of invalidation34.
server <- function(input, output, session) {
  dataset <- reactive(get(input$dataset, "package:datasets"))

  observeEvent(input$dataset, {
    freezeReactiveValue(input, "column")
    updateSelectInput(inputId = "column", choices = names(dataset()))
  })

  output$summary <- renderPrint({
    summary(dataset()[[input$column]])
  })
}
Note that there’s no need to “thaw” the input value; this happens automatically after Shiny detects that the session and server are once again in sync.
You might wonder when you should use freezeReactiveValue(): it’s actually good practice to always use it when you dynamically change an input value.
The actual modification takes some time to flow to the browser then back to Shiny, and in the interim any reads of the value are at best wasted, and at worst lead to errors.
Use freezeReactiveValue() to tell all downstream calculations that an input value is stale and they should save their effort until it’s useful.
10.1.4 Circular references
There’s an important issue we need to discuss if you want to use the update functions to change the current value35 of an input.
From Shiny’s perspective, using an update function to modify value is no different to the user modifying the value by clicking or typing.
That means an update function can trigger reactive updates in exactly the same way that a human can.
This means that you are now stepping outside of the bounds of pure reactive programming, and you need to start worrying about circular references and infinite loops.
For example, take the following simple app.
It contains a single input control and an observer that increments its value by one.
Every time updateNumericInput() runs, it changes input$n, causing updateNumericInput() to run again, so the app gets stuck in an infinite loop constantly increasing the value of input$n.
ui <- fluidPage(
  numericInput("n", "n", 0)
)
server <- function(input, output, session) {
  observeEvent(input$n,
    updateNumericInput(inputId = "n", value = input$n + 1)
  )
}
You’re unlikely to create such an obvious problem in your own app, but it can crop up if you update multiple controls that depend on one another, as in the next example.
10.1.6 Exercises
-
Complete the user interface below with a server function that updates
input$dateso that you can only select dates ininput$year.ui <- fluidPage( numericInput("year", "year", value = 2020), dateInput("date", "date") ) -
Complete the user interface below with a server function that updates
input$countychoices based oninput$state. For an added challenge, also change the label from “County” to “Parish” for Louisiana and “Borough” for Alaska.library(openintro, warn.conflicts = FALSE) #> Loading required package: airports #> Loading required package: cherryblossom #> Loading required package: usdata #> Registered S3 methods overwritten by 'readr': #> method from #> as.data.frame.spec_tbl_df vroom #> as_tibble.spec_tbl_df vroom #> format.col_spec vroom #> print.col_spec vroom #> print.collector vroom #> print.date_names vroom #> print.locale vroom #> str.col_spec vroom states <- unique(county$state) ui <- fluidPage( selectInput("state", "State", choices = states), selectInput("county", "County", choices = NULL) ) -
Complete the user interface below with a server function that updates
input$countrychoices based on theinput$continent. Useoutput$datato display all matching rows.library(gapminder) continents <- unique(gapminder$continent) ui <- fluidPage( selectInput("continent", "Continent", choices = continents), selectInput("country", "Country", choices = NULL), tableOutput("data") ) Extend the previous app so that you can also choose to select all continents, and hence see all countries. You’ll need to add
"(All)"to the list of choices, and then handle that specially when filtering.What is at the heart of the problem described at https://community.rstudio.com/t/29307?
10.2 Dynamic visibility
The next step up in complexity is to selectively show and hide parts of the UI. There are more sophisticated approaches if you know a little JavaScript and CSS, but there’s a useful technique that doesn’t require any extra knowledge: concealing optional UI with a tabset (as introduced in Section 6.3.1). This is a clever hack that allows you to show and hide UI as needed, without having to re-generate it from scratch (as you’ll learn in the next section).
ui <- fluidPage(
  sidebarLayout(
    sidebarPanel(
      selectInput("controller", "Show", choices = paste0("panel", 1:3))
    ),
    mainPanel(
      tabsetPanel(
        id = "switcher",
        type = "hidden",
        tabPanelBody("panel1", "Panel 1 content"),
        tabPanelBody("panel2", "Panel 2 content"),
        tabPanelBody("panel3", "Panel 3 content")
      )
    )
  )
)

server <- function(input, output, session) {
  observeEvent(input$controller, {
    updateTabsetPanel(inputId = "switcher", selected = input$controller)
  })
}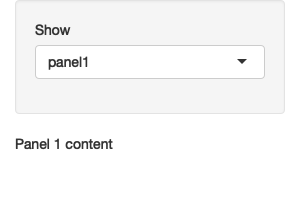
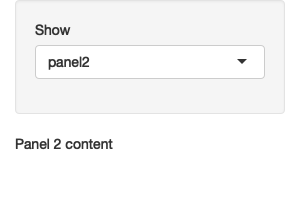

Figure 10.5: Selecting panel1 (left), then panel2 (middle), then panel3 (right). See live at https://hadley.shinyapps.io/ms-dynamic-panels.
There are two main ideas here:
- Use tabset panel with hidden tabs.
- Use
updateTabsetPanel()to switch tabs from the server.
This is a simple idea, but when combined with a little creativity, it gives you a considerable amount of power. The following two sections illustrate a couple of small examples of how you might use it in practice.
10.2.1 Conditional UI
Imagine that you want an app that allows the user to simulate from the normal, uniform, and exponential distributions.
Each distribution has different parameters, so we’ll need some way to show different controls for different distributions.
Here, I’ll put the unique user interface for each distribution in its own tabPanel(), and then arrange the three tabs into a tabsetPanel().
parameter_tabs <- tabsetPanel(
  id = "params",
  type = "hidden",
  tabPanel("normal",
    numericInput("mean", "mean", value = 1),
    numericInput("sd", "standard deviation", min = 0, value = 1)
  ),
  tabPanel("uniform",
    numericInput("min", "min", value = 0),
    numericInput("max", "max", value = 1)
  ),
  tabPanel("exponential",
    numericInput("rate", "rate", value = 1, min = 0),
  )
)
I’ll then embed that inside a fuller UI which allows the user to pick the number of samples and shows a histogram of the results:
ui <- fluidPage(
  sidebarLayout(
    sidebarPanel(
      selectInput("dist", "Distribution",
        choices = c("normal", "uniform", "exponential")
      ),
      numericInput("n", "Number of samples", value = 100),
      parameter_tabs,
    ),
    mainPanel(
      plotOutput("hist")
    )
  )
)
Note that I’ve carefully matched the choices in input$dist to the names of the tab panels.
That makes it easy to write the observeEvent() code below that automatically switches controls when the distribution changes.
The rest of the app uses techniques that you’re already familiar with.
See the final result in Figure 10.6.
server <- function(input, output, session) {
  observeEvent(input$dist, {
    updateTabsetPanel(inputId = "params", selected = input$dist)
  })

  sample <- reactive({
    switch(input$dist,
      normal = rnorm(input$n, input$mean, input$sd),
      uniform = runif(input$n, input$min, input$max),
      exponential = rexp(input$n, input$rate)
    )
  })
  output$hist <- renderPlot(hist(sample()), res = 96)
}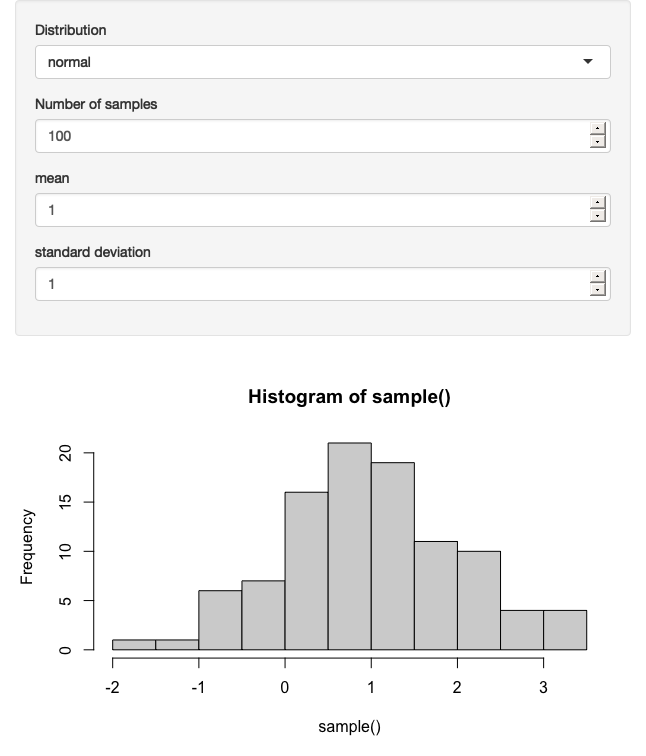
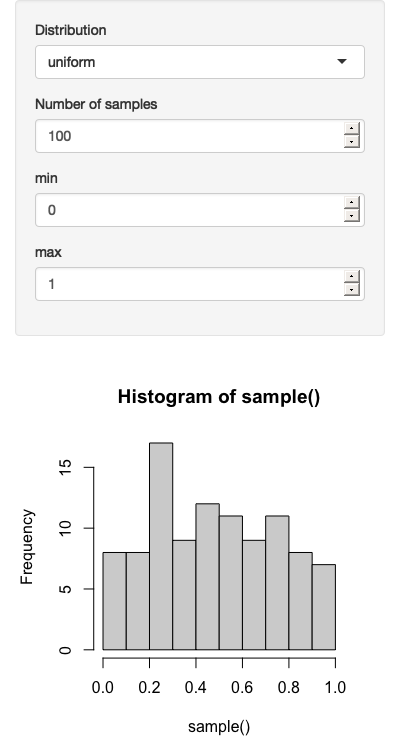
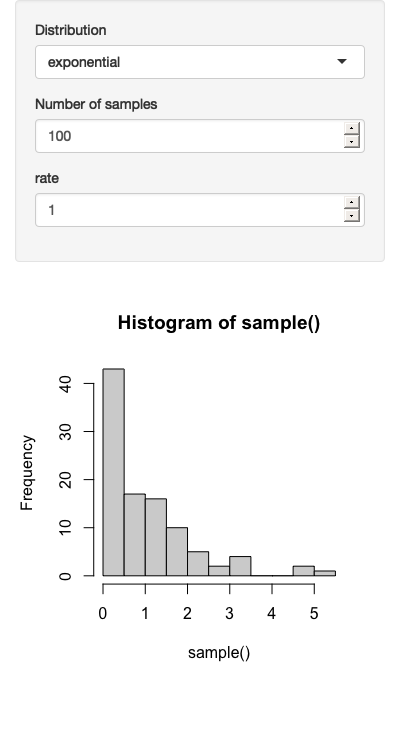
Figure 10.6: Results for normal (left), uniform (middle), and exponential (right) distributions. See live at https://hadley.shinyapps.io/ms-dynamic-conditional.
Note that the value of (e.g.) input$mean is independent of whether or not its visible to the user.
The underlying HTML control still exists; you just can’t see it.
10.2.2 Wizard interface
You can also use this idea to create a “wizard”, a type of interface that makes it easier to collect a bunch of information by spreading it across multiple pages. Here we embed action buttons within each “page”, making it easy to go forward and back. The results are shown in Figure 10.7.
ui <- fluidPage(
  tabsetPanel(
    id = "wizard",
    type = "hidden",
    tabPanel("page_1",
      "Welcome!",
      actionButton("page_12", "next")
    ),
    tabPanel("page_2",
      "Only one page to go",
      actionButton("page_21", "prev"),
      actionButton("page_23", "next")
    ),
    tabPanel("page_3",
      "You're done!",
      actionButton("page_32", "prev")
    )
  )
)

server <- function(input, output, session) {
  switch_page <- function(i) {
    updateTabsetPanel(inputId = "wizard", selected = paste0("page_", i))
  }

  observeEvent(input$page_12, switch_page(2))
  observeEvent(input$page_21, switch_page(1))
  observeEvent(input$page_23, switch_page(3))
  observeEvent(input$page_32, switch_page(2))
}
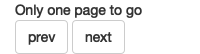

Figure 10.7: A wizard interface portions complex UI over multiple pages. Here we demonstrate the idea with a very simple example, clicking next to advance to the next page. See live at https://hadley.shinyapps.io/ms-wizard.
Note the use of the switch_page() function to reduce the amount of duplication in the server code.
We’ll come back to this idea in Chapter 18, and then create a module to automate wizard interfaces in Section 19.4.2.
10.2.3 Exercises
- Use a hidden tabset to show additional controls only if the user checks an “advanced” check box.
- Create an app that plots
ggplot(diamonds, aes(carat))but allows the user to choose which geom to use:geom_histogram(),geom_freqpoly(), orgeom_density(). Use a hidden tabset to allow the user to select different arguments depending on the geom:geom_histogram()andgeom_freqpoly()have a binwidth argument;geom_density()has abwargument. - Modify the app you created in the previous exercise to allow the user to choose whether each geom is shown or not (i.e. instead of always using one geom, they can picked 0, 1, 2, or 3). Make sure that you can control the binwidth of the histogram and frequency polygon independently.
10.3 Creating UI with code
Sometimes none of the techniques described above gives you the level of dynamism that you need: the update functions only allow you to change existing inputs, and a tabset only works if you have a fixed and known set of possible combinations. Sometimes you need to create different types or numbers of inputs (or outputs), depending on other inputs. This final technique gives you the ability to do so.
It’s worth noting that you’ve always created your user interface with code, but so far you’ve always done it before the app starts. This technique gives you the ability to create and modify the user interface while the app is running. There are two parts to this solution:
uiOutput()inserts a placeholder in yourui. This leaves a “hole” that your server code can later fill in.renderUI()is called withinserver()to fill in the placeholder with dynamically generated UI.
We’ll see how this works with a simple example, and then dive into some realistic uses.
10.3.1 Getting started
Let’s begin with a simple app that dynamically creates an input control, with the type and label control by two other inputs. The resulting app is shown in Figure 10.8.
ui <- fluidPage(
  textInput("label", "label"),
  selectInput("type", "type", c("slider", "numeric")),
  uiOutput("numeric")
)
server <- function(input, output, session) {
  output$numeric <- renderUI({
    if (input$type == "slider") {
      sliderInput("dynamic", input$label, value = 0, min = 0, max = 10)
    } else {
      numericInput("dynamic", input$label, value = 0, min = 0, max = 10)
    }
  })
}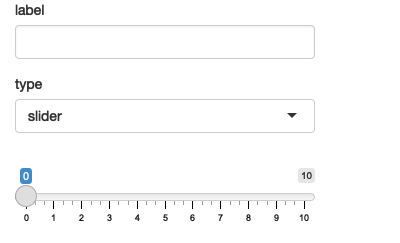
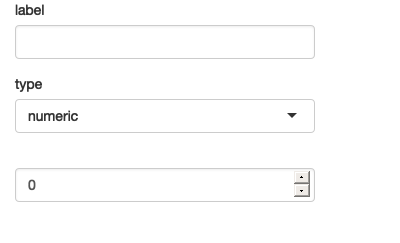
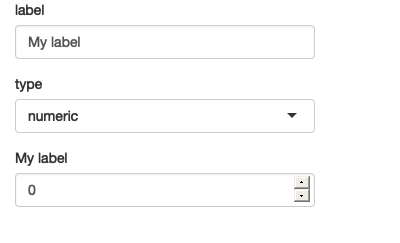
Figure 10.8: App on load (left), then changing type to numeric (middle), then label to ‘my label’. See live at https://hadley.shinyapps.io/ms-render-simple.
If you run this code yourself, you’ll notice that it takes a fraction of a second to appear after the app loads.
That’s because it’s reactive: the app must load, trigger a reactive event, which calls the server function, yielding HTML to insert into the page.
This is one of the downsides of renderUI(); relying on it too much can create a laggy UI.
For good performance, strive to keep fixed as much of the user interface as possible, using the techniques described earlier in the chapter.
There’s one other problem with this approach: when you change controls, you lose the currently selected value.
Maintaining existing state is one of the big challenges of creating UI with code.
This is one reason that selectively showing and hiding UI is a better approach if it works for you — because you’re not destroying and recreating the controls, you don’t need to do anything to preserve the values.
However, in many cases, we can fix the problem by setting the value of the new input to the current value of the existing control:
server <- function(input, output, session) {
  output$numeric <- renderUI({
    value <- isolate(input$dynamic)
    if (input$type == "slider") {
      sliderInput("dynamic", input$label, value = value, min = 0, max = 10)
    } else {
      numericInput("dynamic", input$label, value = value, min = 0, max = 10)
    }
  })
}
The use of isolate() is important.
We’ll come back to what it does in Section 15.4.1, but here it ensures that we don’t create a reactive dependency that would cause this code to re-run every time input$dynamic changes (which will happen whenever the user modifies the value).
We only want it to change when input$type or input$label changes.
10.3.2 Multiple controls
Dynamic UI is most useful when you are generating an arbitrary number or type of controls.
That means that you’ll be generating UI with code, and I recommend using functional programming for this sort of task.
Here I’ll use purrr::map() and purrr::reduce(), but you could certainly do the same with the base lapply() and Reduce() functions.
If you’re not familiar with the map() and reduce() of functional programming, you might want to take a brief detour to read Functional programming before continuing.
We’ll also come back to this idea in Chapter 18.
These are complex ideas, so don’t stress out if it doesn’t make sense on your first read through.
To make this concrete, imagine that you’d like the user to be able to supply their own colour palette.
They’ll first specify how many colours they want, and then supply a value for each colour.
The ui is pretty simple: we have a numericInput() that controls the number of inputs, a uiOutput() where the generated text boxes will go, and a textOutput() that demonstrates that we’ve plumbed everything together correctly.
ui <- fluidPage(
  numericInput("n", "Number of colours", value = 5, min = 1),
  uiOutput("col"),
  textOutput("palette")
)
The server function is short but contains some big ideas:
server <- function(input, output, session) {
  col_names <- reactive(paste0("col", seq_len(input$n)))

  output$col <- renderUI({
    map(col_names(), ~ textInput(.x, NULL))
  })

  output$palette <- renderText({
    map_chr(col_names(), ~ input[[.x]] %||% "")
  })
}
I use a reactive,
col_names(), to store the names of each of the colour inputs I’m about to generate.I then use
map()to create a list oftextInput()s, one each for each name incol_names().renderUI()then takes this list of HTML components and adds it to UI.I need to use a new trick to access the values the input values. So far we’ve always accessed the components of
inputwith$, e.g.input$col1. But here we have the input names in a character vector, likevar <- "col1".$no longer works in this scenario, so we need to swich to[[, i.e.input[[var]].I use
map_chr()to collect all values into a character vector, and display that inoutput$palette. Unfortunately there’s a brief period, just before the new inputs are rendered by the browser, where their values areNULL. This causesmap_chr()to error, which we fix by using the handy%||%function: it returns the right-hand side whenever the left-hand side isNULL.
You can see the results in Figure 10.9.
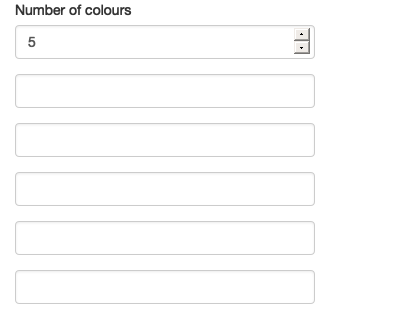
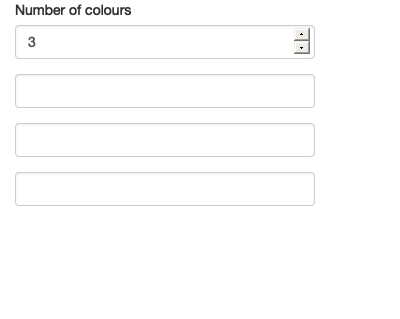
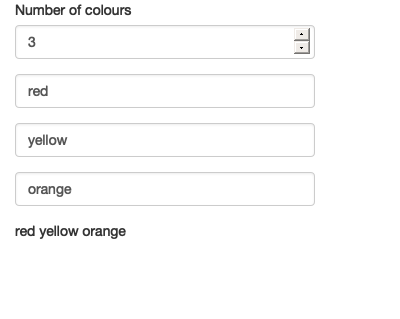
Figure 10.9: App on load (left), after setting n to 3 (middle), then entering some colours (right). See live at https://hadley.shinyapps.io/ms-render-palette.
If you run this app, you’ll discover a really annoying behaviour: whenever you change the number of colours, all the data you’ve entered disappears.
We can fix this problem by using the same technique as before: setting value to the (isolated) current value.
I’ll also tweak the appearance to look a little nicer, including displaying the selected colours in a plot.
Sample screenshots are shown in Figure 10.10.
ui <- fluidPage(
  sidebarLayout(
    sidebarPanel(
      numericInput("n", "Number of colours", value = 5, min = 1),
      uiOutput("col"),
    ),
    mainPanel(
      plotOutput("plot")
    )
  )
)

server <- function(input, output, session) {
  col_names <- reactive(paste0("col", seq_len(input$n)))

  output$col <- renderUI({
    map(col_names(), ~ textInput(.x, NULL, value = isolate(input[[.x]])))
  })

  output$plot <- renderPlot({
    cols <- map_chr(col_names(), ~ input[[.x]] %||% "")
    # convert empty inputs to transparent
    cols[cols == ""] <- NA

    barplot(
      rep(1, length(cols)),
      col = cols,
      space = 0,
      axes = FALSE
    )
  }, res = 96)
}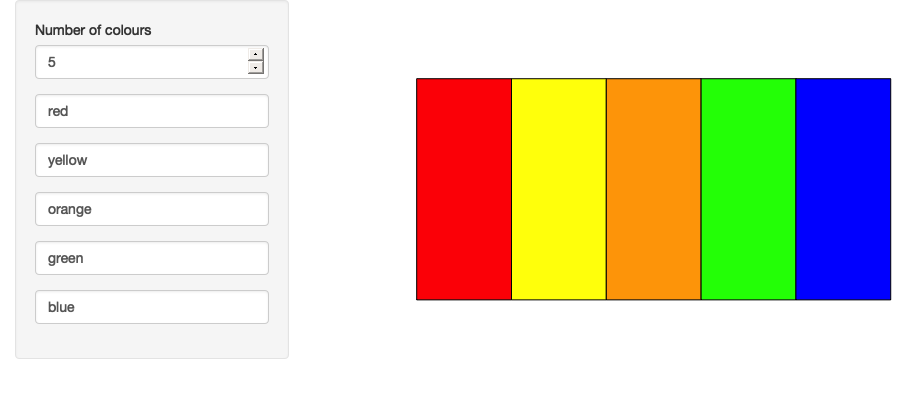
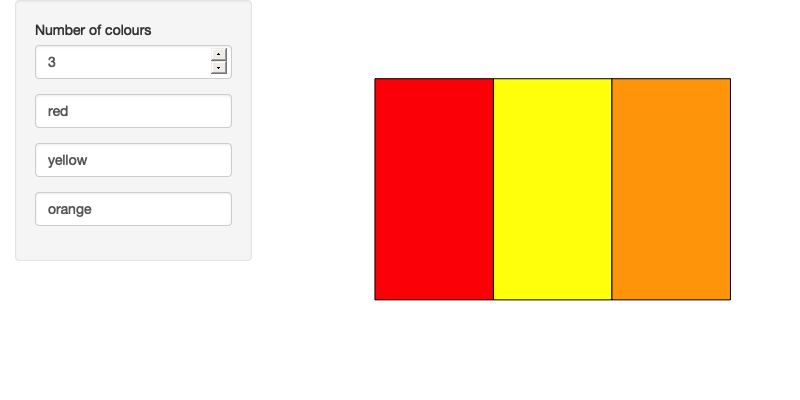
Figure 10.10: Filling out the colours of the rainbow (left), then reducing the number of colours to 3 (right); note that the existing colours are preserved. See live at https://hadley.shinyapps.io/ms-render-palette-full.
10.3.3 Dynamic filtering
To finish off the chapter, I’m going to create an app that lets you dynamically filter any data frame. Each numeric variable will get a range slider and each factor variable will get a multi-select, so (e.g.) if a data frame has three numeric variables and two factors, the app will have three sliders and two select boxes.
I’ll start with a function that creates the UI for a single variable.
It’ll return a range slider for numeric inputs, a multi-select for factor inputs, and NULL (nothing) for all other types.
make_ui <- function(x, var) {
  if (is.numeric(x)) {
    rng <- range(x, na.rm = TRUE)
    sliderInput(var, var, min = rng[1], max = rng[2], value = rng)
  } else if (is.factor(x)) {
    levs <- levels(x)
    selectInput(var, var, choices = levs, selected = levs, multiple = TRUE)
  } else {
    # Not supported
    NULL
  }
}
Then I’ll write the server side equivalent of this function: it takes the variable and value of the input control, and returns a logical vector saying whether or not to include each observation. Using a logical vector makes it easy to combine the results from multiple columns.
filter_var <- function(x, val) {
  if (is.numeric(x)) {
    !is.na(x) & x >= val[1] & x <= val[2]
  } else if (is.factor(x)) {
    x %in% val
  } else {
    # No control, so don't filter
    TRUE
  }
}
I can then use these functions “by hand” to generate a simple filtering UI for the iris dataset:
ui <- fluidPage(
  sidebarLayout(
    sidebarPanel(
      make_ui(iris$Sepal.Length, "Sepal.Length"),
      make_ui(iris$Sepal.Width, "Sepal.Width"),
      make_ui(iris$Species, "Species")
    ),
    mainPanel(
      tableOutput("data")
    )
  )
)
server <- function(input, output, session) {
  selected <- reactive({
    filter_var(iris$Sepal.Length, input$Sepal.Length) &
      filter_var(iris$Sepal.Width, input$Sepal.Width) &
      filter_var(iris$Species, input$Species)
  })

  output$data <- renderTable(head(iris[selected(), ], 12))
}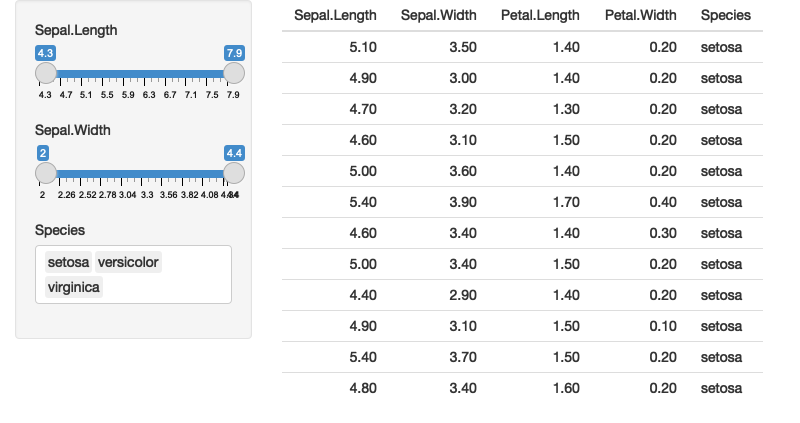
Figure 10.11: Simple filter interface for the iris dataset
You might notice that I got sick of copying and pasting so the app only works with three columns. I can make it work with all the columns by using a little functional programming:
In
uiusemap()to generate one control for each variable.In
server(), I usemap()to generate the selection vector for each variable. Then I usereduce()to take the logical vector for each variable and combine into a single logical vector by&-ing each vector together.
Again, don’t worry too much if you don’t understand exactly what’s happening here. The main take away is that once you master functional programming, you can write very succinct code that generate complex, dynamic apps.
ui <- fluidPage(
  sidebarLayout(
    sidebarPanel(
      map(names(iris), ~ make_ui(iris[[.x]], .x))
    ),
    mainPanel(
      tableOutput("data")
    )
  )
)
server <- function(input, output, session) {
  selected <- reactive({
    each_var <- map(names(iris), ~ filter_var(iris[[.x]], input[[.x]]))
    reduce(each_var, ~ .x & .y)
  })

  output$data <- renderTable(head(iris[selected(), ], 12))
}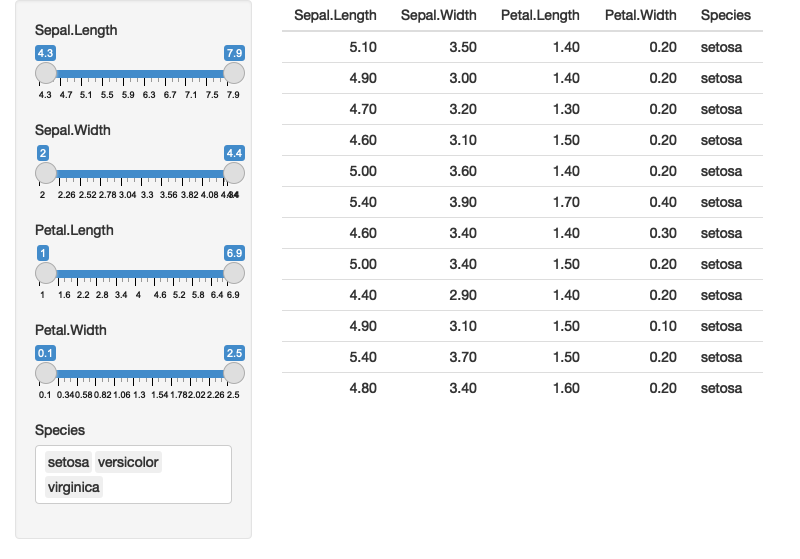
Figure 10.12: Using functional programming to build a filtering app for the iris dataset.
From there, it’s a simple generalisation to work with any data frame. Here I’ll illustrate it using the data frames in the datasets package, but you can easily imagine how you might extend this to user uploaded data. See the result in Figure 10.13.
dfs <- keep(ls("package:datasets"), ~ is.data.frame(get(.x, "package:datasets")))

ui <- fluidPage(
  sidebarLayout(
    sidebarPanel(
      selectInput("dataset", label = "Dataset", choices = dfs),
      uiOutput("filter")
    ),
    mainPanel(
      tableOutput("data")
    )
  )
)
server <- function(input, output, session) {
  data <- reactive({
    get(input$dataset, "package:datasets")
  })
  vars <- reactive(names(data()))

  output$filter <- renderUI(
    map(vars(), ~ make_ui(data()[[.x]], .x))
  )

  selected <- reactive({
    each_var <- map(vars(), ~ filter_var(data()[[.x]], input[[.x]]))
    reduce(each_var, `&`)
  })

  output$data <- renderTable(head(data()[selected(), ], 12))
}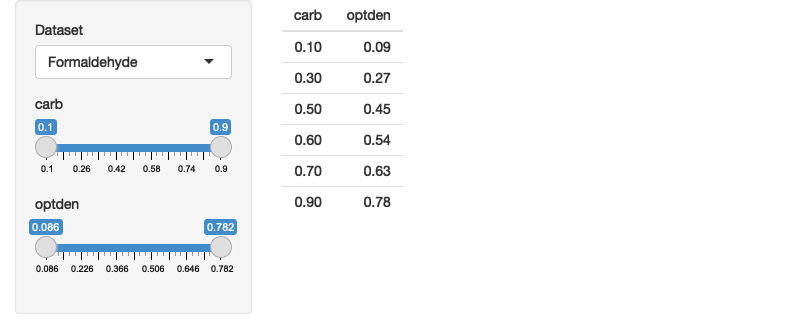
Figure 10.13: A dynamic user interface automatically generated from the fields of the selected dataset. See live at https://hadley.shinyapps.io/ms-filtering-final.
10.3.4 Dialog boxes
Before we finish up, wanted to mention a related technique: dialog boxes.
You’ve seen them already in Section 8.4.1, where the contents of the dialog was a fixed text string.
But because modalDialog() is called from within the server function, you can actually dynamically generate content in the same way as renderUI().
This is a useful technique to have in your back pocket if you want to force the user to make some decision before continuing on with the regular app flow.
10.3.5 Exercises
-
Take this very simple app based on the initial example in the section:
ui <- fluidPage(
  selectInput("type", "type", c("slider", "numeric")),
  uiOutput("numeric")
)
server <- function(input, output, session) {
  output$numeric <- renderUI({
    if (input$type == "slider") {
      sliderInput("n", "n", value = 0, min = 0, max = 100)
    } else {
      numericInput("n", "n", value = 0, min = 0, max = 100)
    }
  })
}
How could you instead implement it using dynamic visibility? If you implement dynamic visibility, how could you keep the values in sync when you change the controls?
-
Explain how this app works. Why does the password disappear when you click the enter password button a second time?
ui <- fluidPage(
  actionButton("go", "Enter password"),
  textOutput("text")
)
server <- function(input, output, session) {
  observeEvent(input$go, {
    showModal(modalDialog(
      passwordInput("password", NULL),
      title = "Please enter your password"
    ))
  })

  output$text <- renderText({
    if (!isTruthy(input$password)) {
      "No password"
    } else {
      "Password entered"
    }
  })
}
In the app in Section 10.3.1, what happens if you drop the
isolate()fromvalue <- isolate(input$dynamic)?Add support for date and date-time columns
make_ui()andfilter_var().(Advanced) If you know the S3 OOP system, consider how you could replace the
ifblocks inmake_ui()andfilter_var()with generic functions.
10.4 Summary
Before reading this chapter, you were limited to creating the user interface statically, before the server function was run. Now you’ve learned how to both modify the user interface and completely recreate it in response to user actions. A dynamic user interface will dramatically increases the complexity of your app, so don’t be surprised if you find yourself struggling to debug what’s going in. Always remember to use to the simplest technique that solves your problem, and fall back to the debugging advice in Section 5.2.
The next chapter switches tack to talk about bookmarking, make it possible to share the current state of an app with others.