2 Basic UI
2.1 Introduction
Now that you have a basic app under your belt, we can start to explore the details that make Shiny tick. As you saw in the previous chapter, Shiny encourages separation of the code that generates your user interface (the front end) from the code that drives your app’s behaviour (the back end).
In this chapter, we’ll focus on the front end, and give you a whirlwind tour of the HTML inputs and outputs provided by Shiny. This gives you the ability to capture many types of data and display many types of R output. You don’t yet have many ways to stitch the inputs and outputs together, but we’ll come back to that in Chapter 6.
Here I’ll mostly stick to the inputs and outputs built into Shiny itself. However, there is a rich and vibrant community of extension packages, like shinyWidgets, colorpicker, and sorttable. You can find a comprehensive, actively-maintained list of other packages at https://github.com/nanxstats/awesome-shiny-extensions, maintained by Nan Xiao.
As usual, we’ll begin by loading the shiny package:
2.2 Inputs
As we saw in the previous chapter, you use functions like sliderInput(), selectInput(), textInput(), and numericInput() to insert input controls into your UI specification.
Now we’ll discuss the common structure that underlies all input functions and give a quick overview of the inputs built into Shiny.
2.2.1 Common structure
All input functions have the same first argument: inputId.
This is the identifier used to connect the front end with the back end: if your UI has an input with ID "name", the server function will access it with input$name.
The inputId has two constraints:
It must be a simple string that contains only letters, numbers, and underscores (no spaces, dashes, periods, or other special characters allowed!). Name it like you would name a variable in R.
It must be unique. If it’s not unique, you’ll have no way to refer to this control in your server function!
Most input functions have a second parameter called label.
This is used to create a human-readable label for the control.
Shiny doesn’t place any restrictions on this string, but you’ll need to carefully think about it to make sure that your app is usable by humans!
The third parameter is typically value, which, where possible, lets you set the default value.
The remaining parameters are unique to the control.
When creating an input, I recommend supplying the inputId and label arguments by position, and all other arguments by name:
sliderInput("min", "Limit (minimum)", value = 50, min = 0, max = 100)The following sections describe the inputs built into Shiny, loosely grouped according to the type of control they create. The goal is to give you a rapid overview of your options, not to exhaustively describe all the arguments. I’ll show the most important parameters for each control below, but you’ll need to read the documentation to get the full details.
2.2.2 Free text
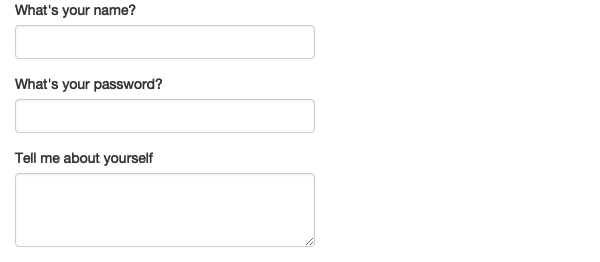
Collect small amounts of text with textInput(), passwords with passwordInput()3, and paragraphs of text with textAreaInput().
ui <- fluidPage(
  textInput("name", "What's your name?"),
  passwordInput("password", "What's your password?"),
  textAreaInput("story", "Tell me about yourself", rows = 3)
)
If you want to ensure that the text has certain properties you can use validate(), which we’ll come back to in Chapter 8.
2.2.3 Numeric inputs
To collect numeric values, create a constrained text box with numericInput() or a slider with sliderInput().
If you supply a length-2 numeric vector for the default value of sliderInput(), you get a “range” slider with two ends.
ui <- fluidPage(
  numericInput("num", "Number one", value = 0, min = 0, max = 100),
  sliderInput("num2", "Number two", value = 50, min = 0, max = 100),
  sliderInput("rng", "Range", value = c(10, 20), min = 0, max = 100)
)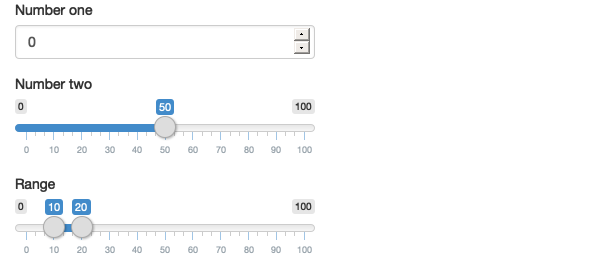
Generally, I recommend only using sliders for small ranges, or cases where the precise value is not so important. Attempting to precisely select a number on a small slider is an exercise in frustration!
Sliders are extremely customisable and there are many ways to tweak their appearance.
See ?sliderInput and https://shiny.rstudio.com/articles/sliders.html for more details.
2.2.4 Dates
Collect a single day with dateInput() or a range of two days with dateRangeInput().
These provide a convenient calendar picker, and additional arguments like datesdisabled and daysofweekdisabled allow you to restrict the set of valid inputs.
ui <- fluidPage(
  dateInput("dob", "When were you born?"),
  dateRangeInput("holiday", "When do you want to go on vacation next?")
)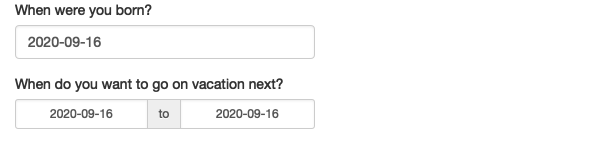
Date format, language, and the day on which the week starts defaults to US standards.
If you are creating an app with an international audience, set format, language, and weekstart so that the dates are natural to your users.
2.2.5 Limited choices
There are two different approaches to allow the user to choose from a prespecified set of options: selectInput() and radioButtons().
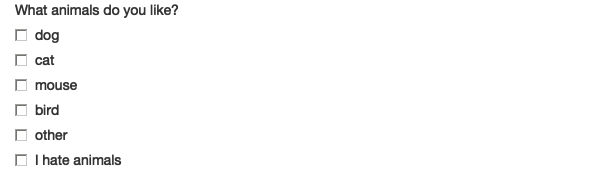
animals <- c("dog", "cat", "mouse", "bird", "other", "I hate animals")

ui <- fluidPage(
  selectInput("state", "What's your favourite state?", state.name),
  radioButtons("animal", "What's your favourite animal?", animals)
)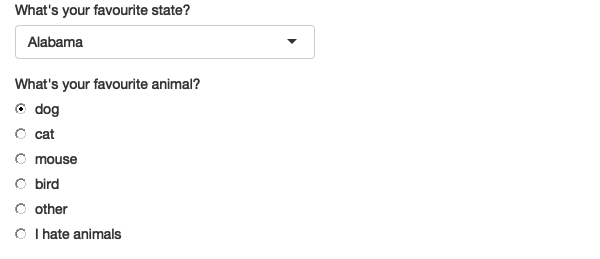
Radio buttons have two nice features: they show all possible options, making them suitable for short lists, and via the choiceNames/choiceValues arguments, they can display options other than plain text.
choiceNames determines what is shown to the user; choiceValues determines what is returned in your server function.
ui <- fluidPage(
  radioButtons("rb", "Choose one:",
    choiceNames = list(
      icon("angry"),
      icon("smile"),
      icon("sad-tear")
    ),
    choiceValues = list("angry", "happy", "sad")
  )
)
Dropdowns created with selectInput() take up the same amount of space, regardless of the number of options, making them more suitable for longer options.
You can also set multiple = TRUE to allow the user to select multiple elements.
ui <- fluidPage(
  selectInput(
    "state", "What's your favourite state?", state.name,
    multiple = TRUE
  )
)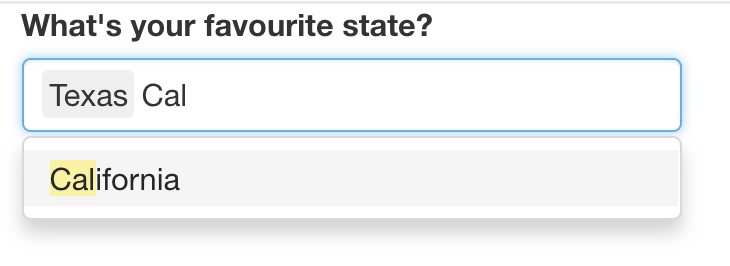
If you have a very large set of possible options, you may want to use “server-side” selectInput() so that the complete set of possible options are not embedded in the UI (which can make it slow to load), but instead sent as needed by the server.
You can learn more about this advanced topic at https://shiny.rstudio.com/articles/selectize.html#server-side-selectize.
There’s no way to select multiple values with radio buttons, but there’s an alternative that’s conceptually similar: checkboxGroupInput().
ui <- fluidPage(
  checkboxGroupInput("animal", "What animals do you like?", animals)
)
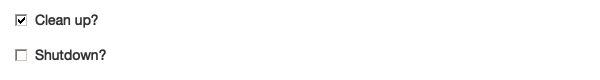
If you want a single checkbox for a single yes/no question, use checkboxInput():
ui <- fluidPage(
  checkboxInput("cleanup", "Clean up?", value = TRUE),
  checkboxInput("shutdown", "Shutdown?")
)
2.2.6 File uploads
Allow the user to upload a file with fileInput():

fileInput() requires special handling on the server side, and is discussed in detail in Chapter 9.
2.2.7 Action buttons
Let the user perform an action with actionButton() or actionLink():
ui <- fluidPage(
  actionButton("click", "Click me!"),
  actionButton("drink", "Drink me!", icon = icon("cocktail"))
)
Actions links and buttons are most naturally paired with observeEvent() or eventReactive() in your server function.
You haven’t learned about these important functions yet, but we’ll come back to them in Section 3.5.
You can customise the appearance using the class argument by using one of "btn-primary", "btn-success", "btn-info", "btn-warning", or "btn-danger".
You can also change the size with "btn-lg", "btn-sm", "btn-xs".
Finally, you can make buttons span the entire width of the element they are embedded within using "btn-block".
ui <- fluidPage(
  fluidRow(
    actionButton("click", "Click me!", class = "btn-danger"),
    actionButton("drink", "Drink me!", class = "btn-lg btn-success")
  ),
  fluidRow(
    actionButton("eat", "Eat me!", class = "btn-block")
  )
)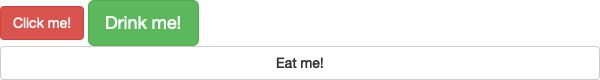
The class argument works by setting the class attribute of the underlying HTML, which affects how the element is styled.
To see other options, you can read the documentation for Bootstrap, the CSS design system used by Shiny: <http://bootstrapdocs.com/v3.3.6/docs/css/#buttons>.
2.2.8 Exercises
-
When space is at a premium, it’s useful to label text boxes using a placeholder that appears inside the text entry area. How do you call
textInput()to generate the UI below?
-
Carefully read the documentation for
sliderInput()to figure out how to create a date slider, as shown below.
Create a slider input to select values between 0 and 100 where the interval between each selectable value on the slider is 5. Then, add animation to the input widget so when the user presses play the input widget scrolls through the range automatically.
If you have a moderately long list in a
selectInput(), it’s useful to create sub-headings that break the list up into pieces. Read the documentation to figure out how. (Hint: the underlying HTML is called<optgroup>.)
2.3 Outputs
Outputs in the UI create placeholders that are later filled by the server function.
Like inputs, outputs take a unique ID as their first argument4: if your UI specification creates an output with ID "plot", you’ll access it in the server function with output$plot.
Each output function on the front end is coupled with a render function in the back end.
There are three main types of output, corresponding to the three things you usually include in a report: text, tables, and plots.
The following sections show you the basics of the output functions on the front end, along with the corresponding render functions in the back end.
2.3.1 Text
Output regular text with textOutput() and fixed code and console output with verbatimTextOutput().
ui <- fluidPage(
textOutput("text"),
verbatimTextOutput("code")
)
server <- function(input, output, session) {
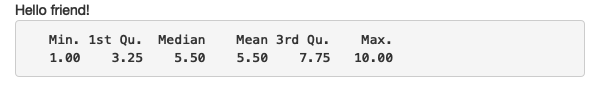
output$text <- renderText({
"Hello friend!"
})
output$code <- renderPrint({
summary(1:10)
})
}
Note that the {} are only required in render functions if you need to run multiple lines of code.
As you’ll learn shortly, you should do as little computation in your render functions as possible, which means you can often omit them.
Here’s what the server function above would look like if written more compactly:
server <- function(input, output, session) {
  output$text <- renderText("Hello friend!")
  output$code <- renderPrint(summary(1:10))
}
Note that there are two render functions which behave slightly differently:
-
renderText()combines the result into a single string, and is usually paired withtextOutput() -
renderPrint()prints the result, as if you were in an R console, and is usually paired withverbatimTextOutput().
We can see the difference with a toy app:
ui <- fluidPage(
  textOutput("text"),
  verbatimTextOutput("print")
)
server <- function(input, output, session) {
  output$text <- renderText("hello!")
  output$print <- renderPrint("hello!")
}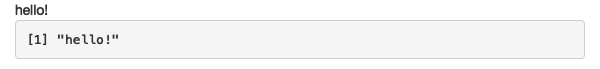
This is equivalent to the difference between cat() and print() in base R.
2.3.2 Tables
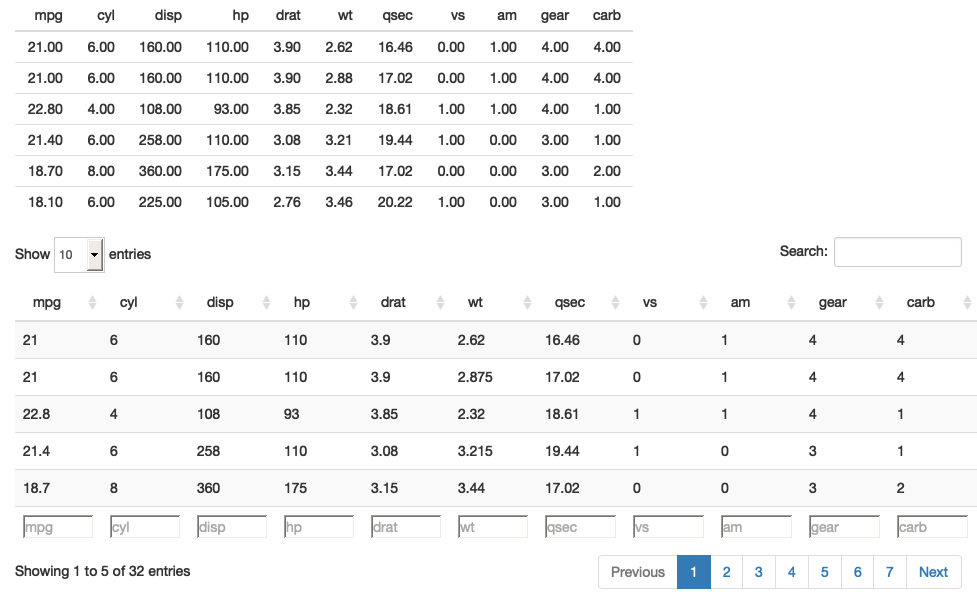
There are two options for displaying data frames in tables:
tableOutput()andrenderTable()render a static table of data, showing all the data at once.dataTableOutput()andrenderDataTable()render a dynamic table, showing a fixed number of rows along with controls to change which rows are visible.
tableOutput() is most useful for small, fixed summaries (e.g. model coefficients); dataTableOutput() is most appropriate if you want to expose a complete data frame to the user.
If you want greater control over the output of dataTableOutput(), I highly recommend the reactable package by Greg Lin.
ui <- fluidPage(
  tableOutput("static"),
  dataTableOutput("dynamic")
)
#> `shiny::dataTableOutput()` is deprecated as of shiny 1.8.1.
#> Please use `DT::DTOutput()` instead.
#> See <https://rstudio.github.io/DT/shiny.html> for more information.
server <- function(input, output, session) {
  output$static <- renderTable(head(mtcars))
  output$dynamic <- renderDataTable(mtcars, options = list(pageLength = 5))
}
2.3.3 Plots
You can display any type of R graphic (base, ggplot2, or otherwise) with plotOutput() and renderPlot():
ui <- fluidPage(
  plotOutput("plot", width = "400px")
)
server <- function(input, output, session) {
  output$plot <- renderPlot(plot(1:5), res = 96)
}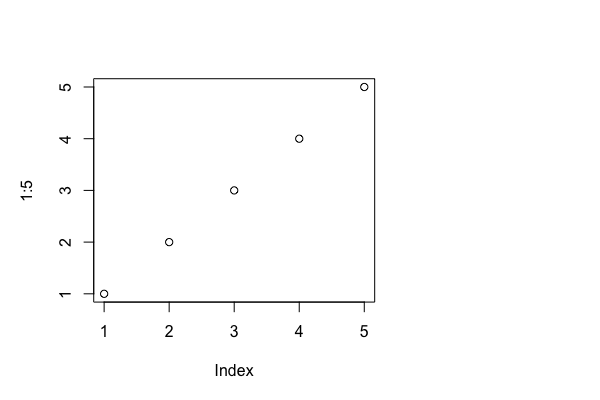
By default, plotOutput() will take up the full width of its container (more on that shortly), and will be 400 pixels high.
You can override these defaults with the height and width arguments.
We recommend always setting res = 96 as that will make your Shiny plots match what you see in RStudio as closely as possible.
Plots are special because they are outputs that can also act as inputs.
plotOutput() has a number of arguments like click, dblclick, and hover.
If you pass these a string, like click = "plot_click", they’ll create a reactive input (input$plot_click) that you can use to handle user interaction on the plot, e.g. clicking on the plot.
We’ll come back to interactive plots in Shiny in Chapter 7.
2.3.4 Downloads
You can let the user download a file with downloadButton() or downloadLink().
These require new techniques in the server function, so we’ll come back to that in Chapter 9.
2.3.5 Exercises
-
Which of
textOutput()andverbatimTextOutput()should each of the following render functions be paired with?renderPrint(summary(mtcars))renderText("Good morning!")renderPrint(t.test(1:5, 2:6))renderText(str(lm(mpg ~ wt, data = mtcars)))
Re-create the Shiny app from Section 2.3.3, this time setting height to 300px and width to 700px. Set the plot “alt” text so that a visually impaired user can tell that its a scatterplot of five random numbers.
-
Update the options in the call to
renderDataTable()below so that the data is displayed, but all other controls are suppressed (i.e., remove the search, ordering, and filtering commands). You’ll need to read?renderDataTableand review the options at https://datatables.net/reference/option/.ui <- fluidPage( dataTableOutput("table") ) #> `shiny::dataTableOutput()` is deprecated as of shiny 1.8.1. #> Please use `DT::DTOutput()` instead. #> See <https://rstudio.github.io/DT/shiny.html> for more information. server <- function(input, output, session) { output$table <- renderDataTable(mtcars, options = list(pageLength = 5)) } Alternatively, read up on reactable, and convert the above app to use it instead.
2.4 Summary
This chapter has introduced you to the major input and output functions that make up the front end of a Shiny app. This was a big info dump, so don’t expect to remember everything after a single read. Instead, come back to this chapter when you’re looking for a specific component: you can quickly scan the figures, and then find the code you need.
In the next chapter, we’ll move on to the back end of a Shiny app: the R code that makes your user interface come to life.