19 Shiny modules
In the last chapter we used functions to decompose parts of your Shiny app into independent pieces. Functions work well for code that is either completely on the server side or completely on the client side. For code that spans both, i.e. whether the server code relies on specific structure in the UI, you’ll need a new technique: modules.
At the simplest level, a module is a pair of UI and server functions.
The magic of modules comes because these functions are constructed in a special way that creates a “namespace”.
So far, when writing an app, the names (ids) of the controls are global: all parts of your server function can see all parts of your UI.
Modules give you the ability to create controls that can only be seen from within the module.
This is called a namespace because it creates “spaces” of “names” that are isolated from the rest of the app.
Shiny modules have two big advantages. Firstly, namespacing makes it easier to understand how your app works because you can write, analyse, and test individual components in isolation. Secondly, because modules are functions they help you reuse code; anything you can do with a function, you can do with a module.
19.1 Motivation
Before we dive into the details of creating modules, it’s useful to get a sense for how they change the “shape” of your app. I’m going to borrow an example from Eric Nantz, who talked about modules at rstudio::conf(2019): https://youtu.be/ylLLVo2VL50. Eric was motivated to use modules because he had a big complex app, as shown in Figure 19.1. You don’t know the specifics of this app, but you can get some sense of the complexity due to the many interconnected components.
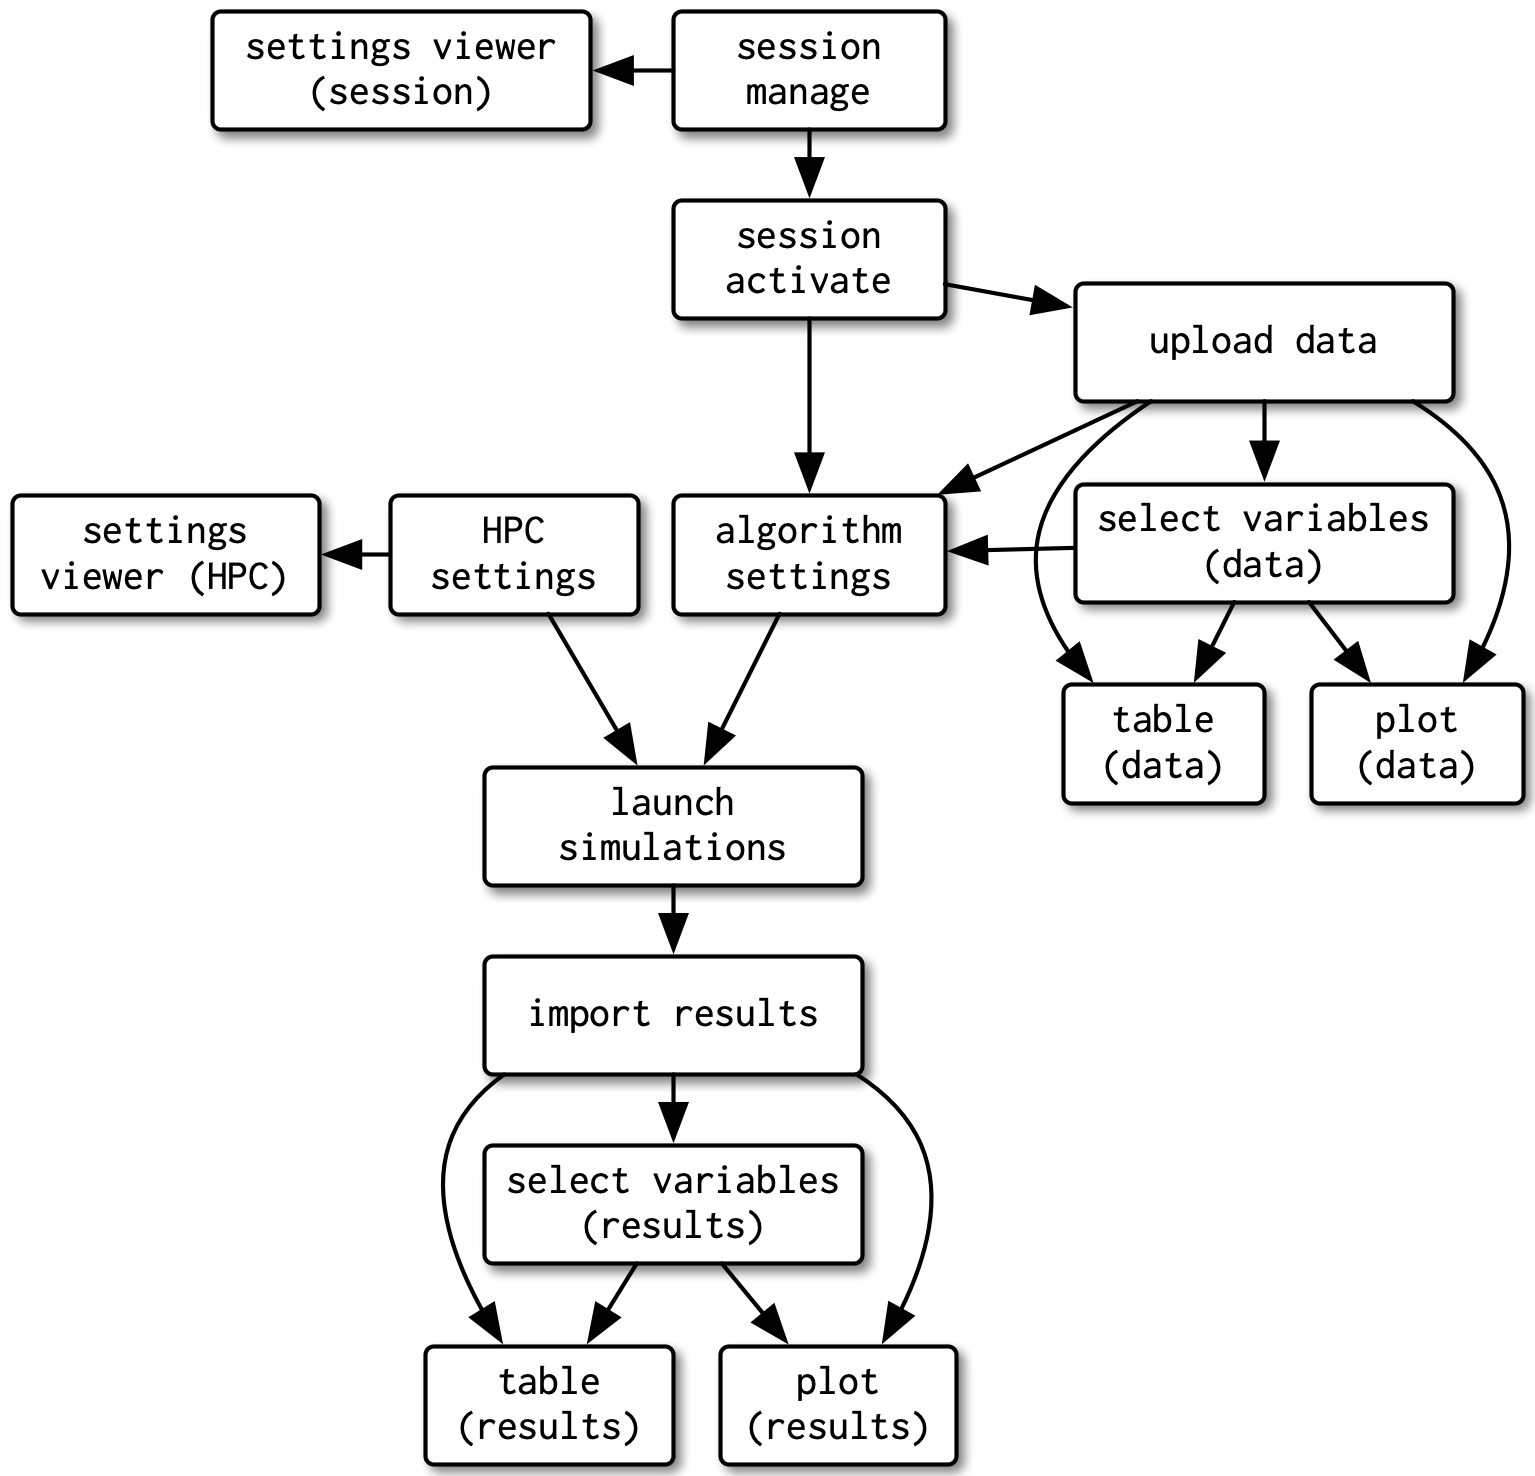
Figure 19.1: A rough sketch of a complex app. I’ve done my best to display it simply in a diagram, but it’s still hard to understand what all the pieces are
Figure 19.2 shows the how the app looks now, after a rewrite that uses modules:
The app is divided up into pieces and each piece has a name. Naming the pieces means that the names of the controls can be simpler. For example, previously the app had “session manage” and “session activate”, but now we only need “manage” and “activate” because those controls are nested inside the session module. This is namespacing!
A module is a black box with defined inputs and outputs. Other modules can only communicate via the interface (outside) of a module, they can’t reach inside and directly inspect or modify the internal controls and reactives. This enforces a simpler structure to the whole app.
Modules are reusable so we can write functions to generate both yellow and both blue components. This can significantly reduce the total amount of code in the app.
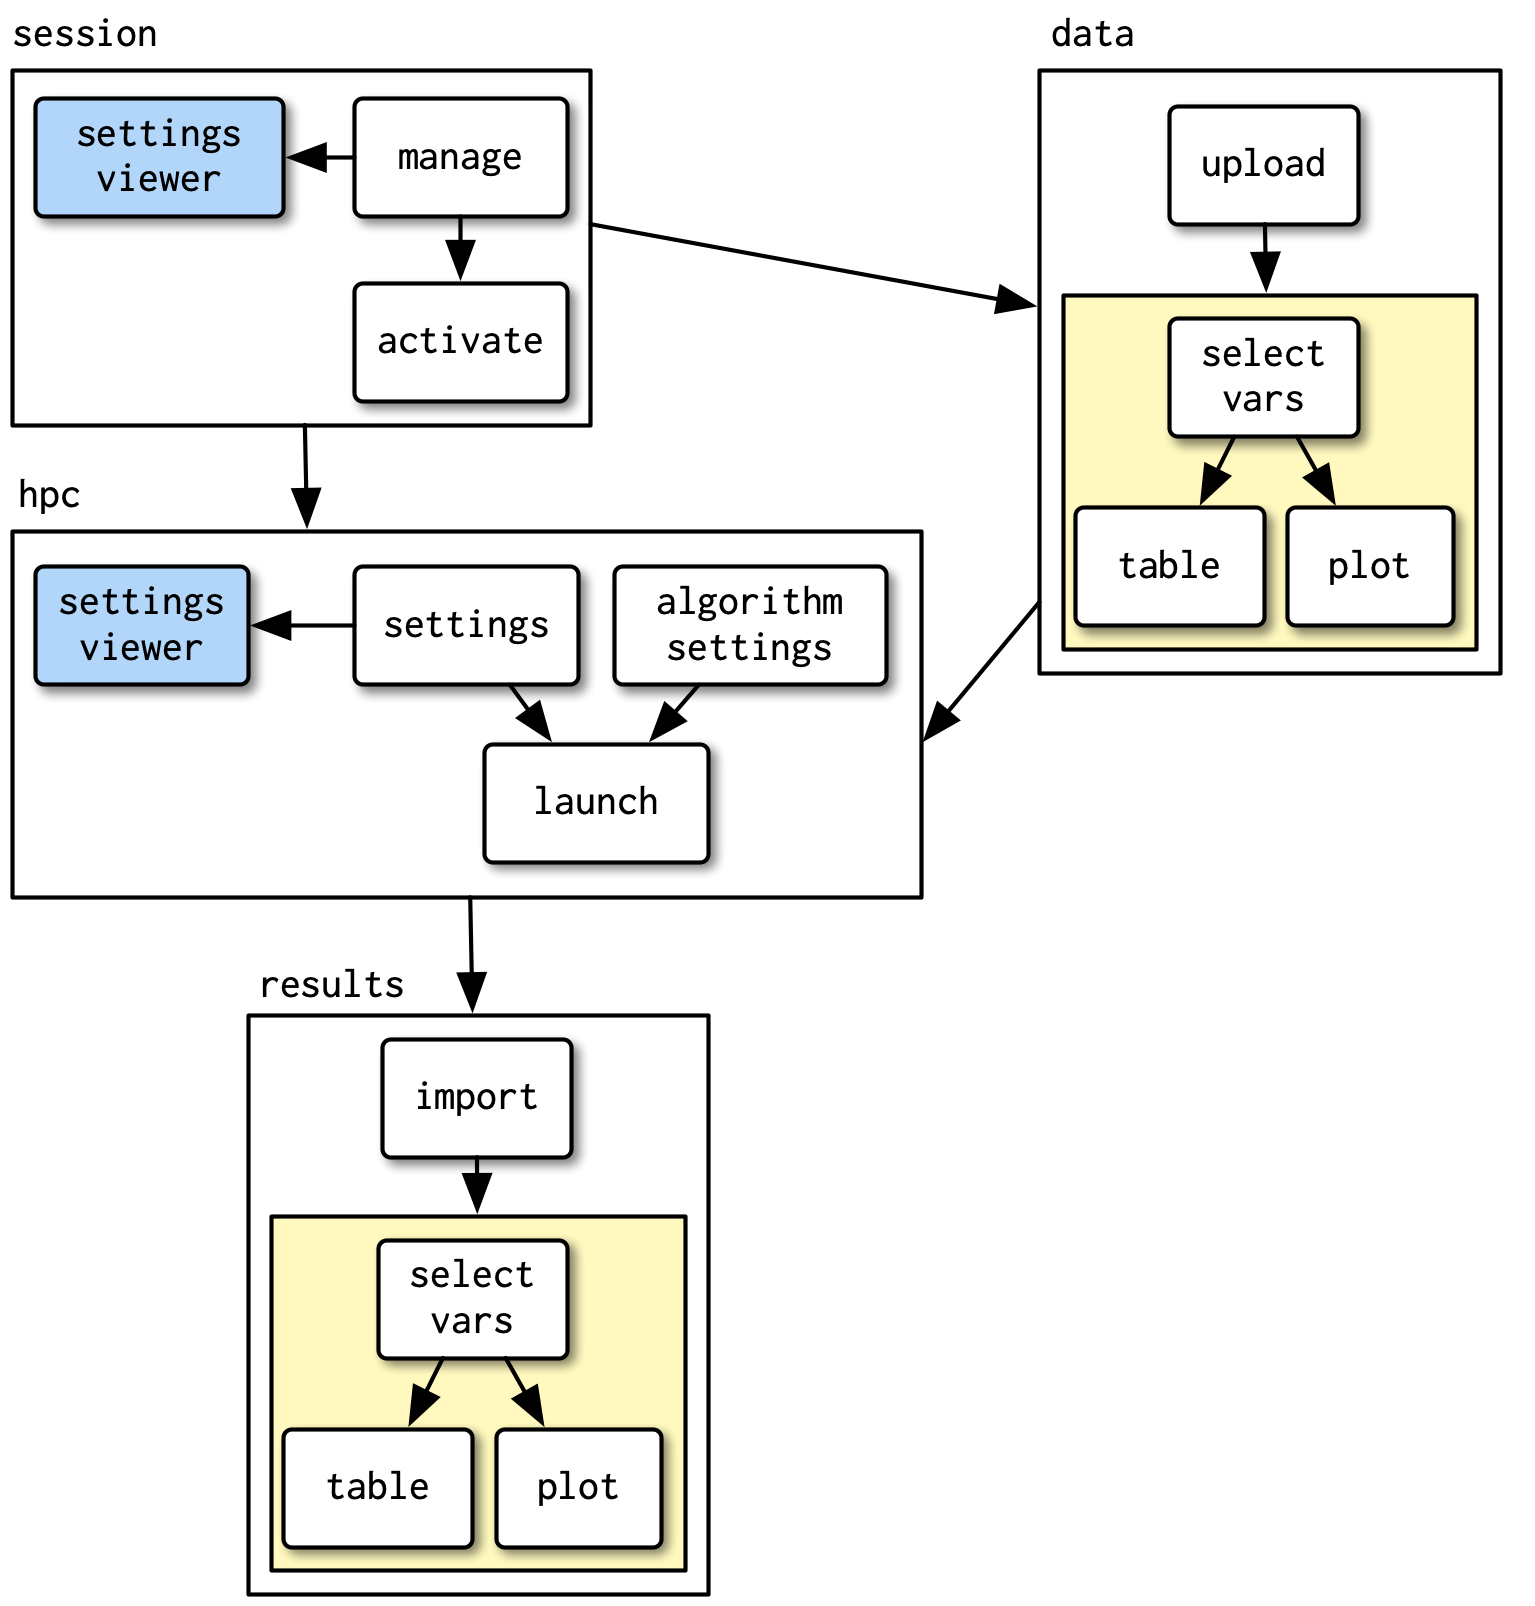
Figure 19.2: After converting the app to use modules, it’s much easier to see the big picture components of the app, and see what is re-used in multiple places (the blue and yellow components).
19.2 Module basics
To create your first module, we’ll pull a module out of a very simple app that draws a histogram:
ui <- fluidPage(
  selectInput("var", "Variable", names(mtcars)),
  numericInput("bins", "bins", 10, min = 1),
  plotOutput("hist")
)
server <- function(input, output, session) {
  data <- reactive(mtcars[[input$var]])
  output$hist <- renderPlot({
    hist(data(), breaks = input$bins, main = input$var)
  }, res = 96)
}
This app is so simple that there’s no real benefit to pulling out a module, but it will serve to illustrate the basic mechanics before we dive into more realistic, and hence complicated, use cases.
A module is very similar to an app. Like an app, it’s composed of two pieces56:
- The module UI function that generates the
uispecification. - The module server function that runs code inside the
serverfunction.
The two functions have standard forms.
They both take an id argument and use it to namespace the module.
To create a module, we need to extract code out of the app UI and server and put it in to the module UI and server.
19.2.1 Module UI
We’ll start with the module UI. There are two steps:
Put the UI code inside a function that has an
idargument.Wrap each existing ID in a call to
NS(), so that (e.g.)"var"turns intoNS(id, "var").
This yields the following function:
histogramUI <- function(id) {
  tagList(
    selectInput(NS(id, "var"), "Variable", choices = names(mtcars)),
    numericInput(NS(id, "bins"), "bins", value = 10, min = 1),
    plotOutput(NS(id, "hist"))
  )
}
Here I’ve returned the UI components in a tagList(), which is a special type of layout function that allows you to bundle together multiple components without actually implying how they’ll be laid out.
It’s the responsibility of the person calling histogramUI() to wrap the result in a layout function like column() or fluidRow() according to their needs.
19.2.2 Module server
Next we tackle the server function.
This gets wrapped inside another function which must have an id argument.
This function calls moduleServer() with the id, and a function that looks like a regular server function:
histogramServer <- function(id) {
  moduleServer(id, function(input, output, session) {
    data <- reactive(mtcars[[input$var]])
    output$hist <- renderPlot({
      hist(data(), breaks = input$bins, main = input$var)
    }, res = 96)
  })
}
The two levels of functions are important here. We’ll come back to them later, but in short they help distinguish the argument to your module from the arguments to the server function. Don’t worry if this looks very complex; it’s basically boilerplate that you can copy and paste for each new module that you create.
Note that moduleServer() takes care of the namespacing automatically: inside of moduleServer(id), input$var and input$bins refer to the inputs with names NS(id, "var") and NS(id, "bins").
19.2.3 Updated app
Now that we have the ui and server functions, it’s good practice to write a function that uses them to generate an app which we can use for experimentation and testing:
histogramApp <- function() {
  ui <- fluidPage(
    histogramUI("hist1")
  )
  server <- function(input, output, session) {
    histogramServer("hist1")
  }
  shinyApp(ui, server)
}
Note that, like all Shiny control, you need to use the same id in both UI and server, otherwise the two pieces will not be connected.
Modules were introduced in Shiny 0.13 (Jan 2016) with callModule() and overhauled in Shiny 1.5.0 (June 2020) with the introduction of moduleServer().
If you’ve learned modules a while ago, you might have learned callModule() and be wondering what the deal is with moduleServer().
These two functions are identical, except that the first two arguments are flipped.
This is a simple change that leads to a rather different structure for the entire app:
histogramServerOld <- function(input, output, session) {
  data <- reactive(mtcars[[input$var]])
  output$hist <- renderPlot({
    hist(data(), breaks = input$bins, main = input$var)
  }, res = 96)
}
server <- function(input, output, session) {
  callModule(histogramServerOld, "hist1")
}
The difference is largely superficial for this simple app, but moduleServer() makes more complicated modules with arguments considerably easier to understand.
19.2.4 Namespacing
Now that we have a complete app, let’s circle back and talk about namespacing some more.
The key idea that makes modules work is that the name of each control (i.e. its id) is now determined by two pieces:
- The first piece comes from the module user, the developer who calls
histogramUI(). - The second piece comes from the module author, the developer who wrote
histogramServer().
This two-part specification means that you, the module author, don’t need to worry about clashing with other UI components created by the user. You have your own “space” of names that you own, and can arrange to best meet your own needs.
Namespacing turns modules into black boxes.
From outside of the module, you can’t see any of the inputs, outputs, or reactives inside of it.
For example, take the app below.
The text output output$out will never get updated because there is no input$bins; the bins input can only be seen inside of the hist1 module.
ui <- fluidPage(
  histogramUI("hist1"),
  textOutput("out")
)
server <- function(input, output, session) {
  histogramServer("hist1")
  output$out <- renderText(paste0("Bins: ", input$bins))
}
If you want to take input from reactives elsewhere in the app, you’ll need to pass them to the module function explicitly; we’ll come back to that shortly.
Note that the module UI and server differ in how the namespacing is expressed:
In the module UI, the namespacing is explicit: you have to call
NS(id, "name")every time you create an input or output.In the module server, the namespacing is implicit. You only need to use
idin the call tomoduleServer()and then Shiny automatically namespacesinputandoutputso that in your module codeinput$namemeans the input with nameNS(id, "name").
19.2.5 Naming conventions
In this example, I’ve used a special naming scheme for all the components of the module, and I recommend that you also use it for your own modules.
Here, the module draws a histogram, so I’ve called it the histogram module.
This base name is then used in a variety of places:
R/histogram.Rholds all the code for the module.histogramUI()is the module UI. If it’s used primarily for input or output I’d call ithistogramInput()orhistogramOuput()instead.histogramServer()is the module server.histogramApp()creates a complete app for interactive experimentation and more formal testing.
19.2.6 Exercises
Why is it good practice to put a module in its own file in the
R/directory? What do you need to do to make sure it’s loaded by your Shiny app?-
The following module UI includes a critical mistake. What is it and why will it cause problems?
histogramUI <- function(id) { tagList( selectInput("var", "Variable", choices = names(mtcars)), numericInput("bins", "bins", value = 10, min = 1), plotOutput("hist") ) } -
The following module generates a new random number every time you click go:
randomUI <- function(id) {
  tagList(
    textOutput(NS(id, "val")),
    actionButton(NS(id, "go"), "Go!")
  )
}
randomServer <- function(id) {
  moduleServer(id, function(input, output, session) {
    rand <- eventReactive(input$go, sample(100, 1))
    output$val <- renderText(rand())
  })
}
Create an app that displays four copies of this module on a single page. Verify that each module is independent. How could you change the return value of
randomUI()to make the display more attractive? -
Are you sick of typing module boilerplate already? Read about RStudio snippets and add the following snippet to your RStudio config to make it even easier to create new modules.
${1}UI <- function(id) {
  tagList(
    ${2}
  )
}

${1}Server <- function(id) {
  moduleServer(id, function(input, output, session) {
    ${3}
  })
}
19.3 Inputs and outputs
Sometimes a module with only an id argument to the module UI and server is useful because it allows you to isolate complex code in its own file.
This is particularly useful for apps that aggregate independent components, such as a corporate dashboard where each tab shows tailored reports for each line of business.
Here modules allow you to develop each piece in its own file without having to worry about IDs clashing across components.
A lot of the time, however, your module UI and server will need additional arguments. Adding arguments to the module UI gives greater control over module appearance, allowing you to use the same module in more places in your app. But the module UI is just a regular R function, so there’s relatively little to learn that’s specific to Shiny, and much of it was already covered in Chapter 18.
So in following sections, I’ll focus on the module server, and discuss how your module can take additional reactive inputs and return one or more reactive outputs. Unlike regular Shiny code, connecting modules together requires you to be explicit about inputs and outputs. Initially, this is going to feel tiresome. And it’s certainly more work than Shiny’s usual free-form association. But modules enforce specific lines of communication for a reason: they’re a little more work to create, but much easier to understand, and allow you to build substantially more complex apps.
You might see advice to use session$userData or other techniques to break out of the module straitjacket.
Be wary of such advice: it’s showing you how to work around the rules imposed by namespacing, making it easy to re-introduce much complexity to your app and significantly reducing the benefits of using a module in the first place.
19.3.1 Getting started: UI input + server output
To see how inputs and outputs work, we’ll start off easy with a module that allows the user to select a dataset from built-in data provided by the datasets package. This isn’t terribly useful by itself, but it illustrates some of the basic principles, is a useful building block for more complex modules, and you’ve seen the idea before in Section 1.4.
We’ll start with the module UI.
Here I use a single additional argument so that you can limit the options to built-in datasets that are either data frames (filter = is.data.frame) or matrices (filter = is.matrix).
I use this argument to optionally filter the objects found in the datasets package, then create a selectInput().
datasetInput <- function(id, filter = NULL) {
  names <- ls("package:datasets")
  if (!is.null(filter)) {
    data <- lapply(names, get, "package:datasets")
    names <- names[vapply(data, filter, logical(1))]
  }

  selectInput(NS(id, "dataset"), "Pick a dataset", choices = names)
}
The module server is also simple: we just use get() to retrieve the dataset with its name.
There’s one new idea here: like a function and unlike a regular server(), this module server returns a value.
Here we take advantage of the usual rule that the last expression processed in the function becomes the return value57.
This value should always be a reactive.
datasetServer <- function(id) {
  moduleServer(id, function(input, output, session) {
    reactive(get(input$dataset, "package:datasets"))
  })
}
To use a module server that returns something, you just have to capture its return value with <-.
That’s demonstrated in the module app below, where I capture the dataset and then display it in a tableOutput().
datasetApp <- function(filter = NULL) {
  ui <- fluidPage(
    datasetInput("dataset", filter = filter),
    tableOutput("data")
  )
  server <- function(input, output, session) {
    data <- datasetServer("dataset")
    output$data <- renderTable(head(data()))
  }
  shinyApp(ui, server)
}
I’ve made a few executive decisions in my design of this function:
It takes a
filterargument that’s passed along to the module UI, making it easy to experiment with that input argument.I use a tabular output to show all the data. It doesn’t really matter what you use here, but the more expressive your UI, the easier it is to check that the module does what you expect.
19.3.2 Case study: selecting a numeric variable
Next, we’ll create a control that allows the user to select variables of specified type from a given reactive dataset. Because we want the dataset to be reactive, we can’t fill in the choices when we start the app. This makes the module UI very simple:
selectVarInput <- function(id) {
  selectInput(NS(id, "var"), "Variable", choices = NULL)
}
The server function will have two arguments:
The
datato select variables from. I want this to be reactive so it can work with thedatasetmodule I created above.-
A
filterused to select which variables to list. This will be set by the caller of the module, so doesn’t need to be reactive. To keep the module server simple, I’ve extracted out the key idea into a helper function:
Then the module server uses observeEvent() to update the selectInput choices when the data changes, and returns a reactive that provides the values of the selected variable.
selectVarServer <- function(id, data, filter = is.numeric) {
  moduleServer(id, function(input, output, session) {
    observeEvent(data(), {
      updateSelectInput(session, "var", choices = find_vars(data(), filter))
    })

    reactive(data()[[input$var]])
  })
}
To make our app, we again capture the results of the module server and connect it to an output in our UI.
I want to make sure all the reactive plumbing is correct, so I use the dataset module as a source of reactive data frames.
selectVarApp <- function(filter = is.numeric) {
  ui <- fluidPage(
    datasetInput("data", is.data.frame),
    selectVarInput("var"),
    verbatimTextOutput("out")
  )
  server <- function(input, output, session) {
    data <- datasetServer("data")
    var <- selectVarServer("var", data, filter = filter)
    output$out <- renderPrint(var())
  }

  shinyApp(ui, server)
}
19.3.3 Server inputs
When designing a module server, you need to think about who is going to provide the value for each argument: is it the R programmer calling your module, or the person using the app? Another way to think about this is when can the value change: is it fixed and constant over the life-time of the app, or is it reactive, changing as the user interacts with the app? This is an important design decision that determines whether or not an argument should be a reactive or not.
Once you’ve made this decision, I think it’s good practice to check that each input to your module is either reactive or constant.
If you don’t, and the user supplies the wrong type, they’ll get a cryptic error message.
You can make the life of module user much easier with a quick and dirty call to stopifnot().
For example, selectVarServer() could check that data is reactive and filter is not with the following code:
selectVarServer <- function(id, data, filter = is.numeric) {
  stopifnot(is.reactive(data))
  stopifnot(!is.reactive(filter))

  moduleServer(id, function(input, output, session) {
    observeEvent(data(), {
      updateSelectInput(session, "var", choices = find_vars(data(), filter))
    })

    reactive(data()[[input$var]])
  })
}
If you expect the module to be used many times by many people, you might also consider hand crafting an error message with an if statement and a call to stop().
Checking that the module inputs are reactive (or not) helps you avoid a common problem when you mix modules with other input controls.
input$var is not a reactive, so whenever you pass an input value into a module, you’ll need to wrap it in a reactive() (e.g. selectVarServer("var", reactive(input$x))).
If you check the inputs like I recommend here you’ll get a clear error; if you don’t, you’ll get something cryptic like could not find function "data".
You might also apply this strategy to find_vars().
It’s not quite as important here, but because debugging Shiny apps is a little harder than debugging regular R code, I think it does make sense to invest a little more time in checking inputs so that you get clearer error messages when something goes wrong.
find_vars <- function(data, filter) {
  stopifnot(is.data.frame(data))
  stopifnot(is.function(filter))
  names(data)[vapply(data, filter, logical(1))]
}
This caught a couple of errors that I made while working on this chapter.
19.3.4 Modules inside of modules
Before we continue on to talk more about outputs from your server function, I wanted to highlight that modules are composable, and it may make sense to create a module that itself contains a module.
For example, we could combine the dataset and selectVar modules to make a module that allows the user to pick a variable from a built-in dataset:
selectDataVarUI <- function(id) {
  tagList(
    datasetInput(NS(id, "data"), filter = is.data.frame),
    selectVarInput(NS(id, "var"))
  )
}
selectDataVarServer <- function(id, filter = is.numeric) {
  moduleServer(id, function(input, output, session) {
    data <- datasetServer("data")
    var <- selectVarServer("var", data, filter = filter)
    var
  })
}

selectDataVarApp <- function(filter = is.numeric) {
  ui <- fluidPage(
    sidebarLayout(
      sidebarPanel(selectDataVarUI("var")),
      mainPanel(verbatimTextOutput("out"))
    )
  )
  server <- function(input, output, session) {
    var <- selectDataVarServer("var", filter)
    output$out <- renderPrint(var(), width = 40)
  }
  shinyApp(ui, server)
}
19.3.5 Case study: histogram
Now let’s circle back to the original histogram module and refactor it into something more composable. The key challenge of creating modules is creating functions that are flexible enough to be used in multiple places, but simple enough that they can easily be understood. Figuring out how to write functions that are good building blocks is the journey of a lifetime; expect that you’ll have to do it wrong quite a few times before you get it right. (I wish I could offer more concrete advice here, but currently this is a skill that you’ll have to refine through practice and conscious reflection.)
I’m also going to consider it as an output control because while it does use an input (the number of bins) that’s used only to tweak the display, and doesn’t need to be returned by the module.
histogramOutput <- function(id) {
  tagList(
    numericInput(NS(id, "bins"), "bins", 10, min = 1, step = 1),
    plotOutput(NS(id, "hist"))
  )
}
I’ve decided to give this module two inputs: x, the variable to plot, and a title for the histogram.
Both will be reactive so that they can change over time.
(The title is a bit frivolous but it’s going to motivate an important technique very shortly).
Note the default value of title: it has to be reactive, so we need to wrap a constant value inside of reactive().
histogramServer <- function(id, x, title = reactive("Histogram")) {
  stopifnot(is.reactive(x))
  stopifnot(is.reactive(title))

  moduleServer(id, function(input, output, session) {
    output$hist <- renderPlot({
      req(is.numeric(x()))
      main <- paste0(title(), " [", input$bins, "]")
      hist(x(), breaks = input$bins, main = main)
    }, res = 96)
  })
}
histogramApp <- function() {
  ui <- fluidPage(
    sidebarLayout(
      sidebarPanel(
        datasetInput("data", is.data.frame),
        selectVarInput("var"),
      ),
      mainPanel(
        histogramOutput("hist")
      )
    )
  )

  server <- function(input, output, session) {
    data <- datasetServer("data")
    x <- selectVarServer("var", data)
    histogramServer("hist", x)
  }
  shinyApp(ui, server)
}
# histogramApp()
Note that if you wanted to allow the module user to place the breaks control and histogram in different places of the app, you could use multiple UI functions. It’s not terribly useful here, but it’s useful to see the basic approach.
histogramOutputBins <- function(id) {
  numericInput(NS(id, "bins"), "bins", 10, min = 1, step = 1)
}
histogramOutputPlot <- function(id) {
  plotOutput(NS(id, "hist"))
}

ui <- fluidPage(
  sidebarLayout(
    sidebarPanel(
      datasetInput("data", is.data.frame),
      selectVarInput("var"),
      histogramOutputBins("hist")
    ),
    mainPanel(
      histogramOutputPlot("hist")
    )
  )
)
19.3.6 Multiple outputs
It would be nice if we could include the name of selected variable in the title of the histogram.
There’s currently no way to do that because selectVarServer() only returns the value of the variable, not its name.
We could certainly rewrite selectVarServer() to return the name instead, but then the module user would have to do the subsetting.
A better approach would be for the selectVarServer() to return both the name and the value.
A server function can return multiple values exactly the same way that any R function can return multiple values: by returning a list.
Below we modify selectVarServer() to return both the name and value, as reactives.
selectVarServer <- function(id, data, filter = is.numeric) {
  stopifnot(is.reactive(data))
  stopifnot(!is.reactive(filter))

  moduleServer(id, function(input, output, session) {
    observeEvent(data(), {
      updateSelectInput(session, "var", choices = find_vars(data(), filter))
    })

    list(
      name = reactive(input$var),
      value = reactive(data()[[input$var]])
    )
  })
}
Now we can update our histogramApp() to make use of this.
The UI stays the same; but now we pass both the selected variable’s value and its name to histogramServer().
histogramApp <- function() {
  ui <- fluidPage(...)

  server <- function(input, output, session) {
    data <- datasetServer("data")
    x <- selectVarServer("var", data)
    histogramServer("hist", x$value, x$name)
  }
  shinyApp(ui, server)
}
The main challenge with this sort of code is remembering when you use the reactive (e.g. x$value) vs. when you use its value (e.g. x$value()).
Just remember that when passing an argument to a module, you want the module to react to the value changing which means that you have to pass the reactive, not it’s current value.
If you find yourself frequently returning multiple values from a reactive, you might also consider using the zeallot package.
zeallot provides the %<-% operator which allows you to assign into multiple variables (sometimes called multiple, unpacking, or destructuring assignment).
This can be useful when returning multiple values because you avoid a layer of indirection.
19.3.7 Exercises
Rewrite
selectVarServer()so that bothdataandfilterare reactive. Then use it with an app function that lets the user pick the dataset with thedatasetmodule and filtering function usingselectInput(). Give the user the ability to filter numeric, character, or factor variables.-
The following code defines output and server components of a module that takes a numeric input and produces a bulleted list of three summary statistics. Create an app function that allows you to experiment with it. The app function should take a data frame as input, and use
numericVarSelectInput()to pick the variable to summarise.summaryOutput <- function(id) { tags$ul( tags$li("Min: ", textOutput(NS(id, "min"), inline = TRUE)), tags$li("Max: ", textOutput(NS(id, "max"), inline = TRUE)), tags$li("Missing: ", textOutput(NS(id, "n_na"), inline = TRUE)) ) } summaryServer <- function(id, var) { moduleServer(id, function(input, output, session) { rng <- reactive({ req(var()) range(var(), na.rm = TRUE) }) output$min <- renderText(rng()[[1]]) output$max <- renderText(rng()[[2]]) output$n_na <- renderText(sum(is.na(var()))) }) } -
The following module input provides a text control that lets you type a date in ISO8601 format (yyyy-mm-dd). Complete the module by providing a server function that uses
output$errorto display a message if the entered value is not a valid date. The module should return aDateobject for valid dates. (Hint: usestrptime(x, "%Y-%m-%d")to parse the string; it will returnNAif the value isn’t a valid date.)
19.4 Case studies
To summarise what you’ve learned so far:
Module inputs (i.e. additional arguments to the module server) can be reactives or constants. The choice is a design decision that you make based on who sets the arguments and when they change. You should always check the arguments are of the expected type to avoid unhelpful error messages.
Unlike app servers, but like regular functions, module servers can return values. The return value of a module should always be a reactive or, if you want to return multiple values, a list of reactives.
To help these ideas to sink in, I’ll present a few case studies that show a few more examples of using modules. Unfortunately I don’t have the space to show every possible way you might use a module to help simplify your app, but hopefully these examples will give you a little flavour for what you can do, and suggest directions to consider in the future.
19.4.1 Limited selection + other
Another important use of modules is to give complex UI elements a simpler user interface. Here I’m going to create a useful control that Shiny doesn’t provide by default: a small set of options displayed with radio buttons coupled with an “other” field. The inside of this module uses multiple input elements, but from the outside it works as a single combined object.
I’m going to parametrise the UI side with label, choices, and selected which get passed directly to radioButtons().
I also create a textInput() containing a placeholder, that defaults to “Other”.
To combine the text box and the radio button, I take advantage of the fact that choiceNames can be a list of HTML elements, including other input widgets.
Figure 19.3 gives you a sense of what it’ll look like.
radioExtraUI <- function(id, label, choices, selected = NULL, placeholder = "Other") {
  other <- textInput(NS(id, "other"), label = NULL, placeholder = placeholder)

  names <- if (is.null(names(choices))) choices else names(choices)
  values <- unname(choices)

  radioButtons(NS(id, "primary"),
    label = label,
    choiceValues = c(names, "other"),
    choiceNames = c(as.list(values), list(other)),
    selected = selected
  )
}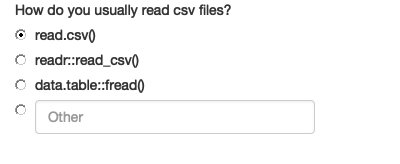
Figure 19.3: An example using radioExtraUI() to find out how you usually read CSV files
On the server, I want to automatically select the “other” radio button if you modify the placeholder value. You could also imagine using validation to ensure that some text is present if other is selected.
radioExtraServer <- function(id) {
  moduleServer(id, function(input, output, session) {
    observeEvent(input$other, ignoreInit = TRUE, {
      updateRadioButtons(session, "primary", selected = "other")
    })

    reactive({
      if (input$primary == "other") {
        input$other
      } else {
        input$primary
      }
    })
  })
}
Then I wrap up both pieces in an app function so that I can test it.
Here I use … to pass down any number of arguments into my radioExtraUI().
Figure 19.4 gives you a sense of how it behaves.
radioExtraApp <- function(...) {
  ui <- fluidPage(
    radioExtraUI("extra", ...),
    textOutput("value")
  )
  server <- function(input, output, server) {
    extra <- radioExtraServer("extra")
    output$value <- renderText(paste0("Selected: ", extra()))
  }

  shinyApp(ui, server)
}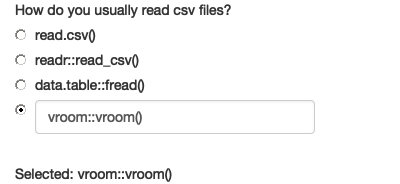
Figure 19.4: Testing radioExtraApp() with the same question about how you read CSVs. Now, if you type something in the other field, the corresponding radio button is automatically selected.
You could continue to wrap up this module for still more specific purposes. For example, one variable that requires a little care is gender, because there are many different ways for people to express their gender.
genderUI <- function(id, label = "Gender") {
  radioExtraUI(id,
    label = label,
    choices = c(
      male = "Male",
      female = "Female",
      na = "Prefer not to say"
    ),
    placeholder = "Self-described",
    selected = "na"
  )
}
Here it’s important to provide the most common choices, male and female, an option to not provide that data, and then a write in option where people can use whatever term they’re most comfortable with. It’s considerate not to use a placeholder of “other” here.
For a deeper dive on this issue, and a discussion of why many commonly used ways of asking about gender can be hurtful to some people, I recommend reading “Designing forms for gender diversity and inclusion” by Sabrina Fonseca or Standard for Sex, Gender, Variations of Sex Characteristics and Sexual Orientation Variables by The Australian Bureau of Statistics.
19.4.2 Wizard
Next we’ll tackle a pair of case studies that dive into some subtleties of namespacing, where the UI is generated at different time by different people. These situations are complex because you need to remember the details of how namespacing works.
We’ll start with a module that wraps up a wizard interface, a style of UI where you break a complex process down into a series of simple pages that the user works through one-by-one. I showed how to create a basic wizard in Section 10.2.2. Now we’ll automate the process, so that when creating a wizard you can focus on the content of each page, rather on how they are connected together to form a whole.
To explain this module I’m going to start from the bottom and we’ll work our way up. The main part of the wizard UI are the buttons. Each page has two buttons: one to take them on to the next page, and one to return them to the previous. We’ll start by creating helpers to build these buttons:
nextPage <- function(id, i) {
  actionButton(NS(id, paste0("go_", i, "_", i + 1)), "next")
}
prevPage <- function(id, i) {
  actionButton(NS(id, paste0("go_", i, "_", i - 1)), "prev")
}
The only real complexity here is the id: since each input element needs to have a unique id, the id for each button needs to include both the current and the destination page.
Next I write a function to generate a page of the wizard. This includes a “title” (not shown, but used to identify the page for switching), the contents of the page (supplied by the user), and the two buttons58.
wrapPage <- function(title, page, button_left = NULL, button_right = NULL) {
  tabPanel(
    title = title,
    fluidRow(
      column(12, page)
    ),
    fluidRow(
      column(6, button_left),
      column(6, button_right)
    )
  )
}
Then we can put it all together to generate the whole wizard.
We loop over the list of pages provided by the user, create the buttons, then wrap up the user supplied page into a tabPanel, then combine all the panels into a tabsetPanel.
Note that there are two special cases for buttons:
The first page doesn’t have a previous button. Here I use a trick that
ifreturnsNULLif the condition isFALSEand there is no else block.The last page uses an input control supplied by the user. I think this is the simplest way to allow the user to control what happens when the wizard is done.
wizardUI <- function(id, pages, doneButton = NULL) {
  stopifnot(is.list(pages))
  n <- length(pages)

  wrapped <- vector("list", n)
  for (i in seq_along(pages)) {
    # First page only has next; last page only prev + done
    lhs <- if (i > 1) prevPage(id, i)
    rhs <- if (i < n) nextPage(id, i) else doneButton
    wrapped[[i]] <- wrapPage(paste0("page_", i), pages[[i]], lhs, rhs)
  }

  # Create tabsetPanel
  # https://github.com/rstudio/shiny/issues/2927
  wrapped$id <- NS(id, "wizard")
  wrapped$type <- "hidden"
  do.call("tabsetPanel", wrapped)
}


Figure 19.5: A simple example of the wizard UI.
The code to create the tabset panel requires a little explanation: unfortunately tabsetPanel() doesn’t allow us to pass in a list of tabs.
So instead we need to do a little do.call() magic to make it work.
do.call(function_name, list(arg1, arg2, …) is equivalent to function_name(arg1, arg2, …), so here we’re creating a call like tabsetPanel(pages[[1]], pages[[2]], …, id = NS(id, "wizard"), type = "hidden").
Hopefully this will be simplified in a future version of Shiny.
Now that we’ve completed the module UI, we need to turn our attention to the module server.
The essence of the server is straightforward: we just need to make buttons work, so that you can travel from page-to-page in either direction.
To do that we need to setup a observeEvent() for each button that calls updateTabsetPanel().
This would be relatively simple if we knew exactly how many pages there were.
But we don’t, because the user of the module gets to control that.
So instead, we need to do a little functional programming to set up the (n - 1) * 2 observers (two observers for each page except for the first and last, which only need one).
The server function below starts by extracting out the basic code we need for one button in the changePage() function.
It uses input[[]], as in Section 10.3.2, so we can refer to control dynamically.
Then we use lapply() to loop over all the previous buttons (needed for every page except the first), and all the next buttons (needed for every page except the last).
wizardServer <- function(id, n) {
  moduleServer(id, function(input, output, session) {
    changePage <- function(from, to) {
      observeEvent(input[[paste0("go_", from, "_", to)]], {
        updateTabsetPanel(session, "wizard", selected = paste0("page_", to))
      })
    }
    ids <- seq_len(n)
    lapply(ids[-1], function(i) changePage(i, i - 1))
    lapply(ids[-n], function(i) changePage(i, i + 1))
  })
}
Note that it’s not possible to use a for loop instead of map()/lapply() here.
A for loop works by changing the value of the same i variable so that by the time the loop is done, every changePage() would use use the same value.
map() and lapply() work by creating new environments each with their own value of i.
Now we can construct an app and simple example to make sure we’ve plumbed everything together correctly:
wizardApp <- function(...) {
  pages <- list(...)

  ui <- fluidPage(
    wizardUI("whiz", pages)
  )
  server <- function(input, output, session) {
    wizardServer("whiz", length(pages))
  }
  shinyApp(ui, server)
}
Unfortunately we need to repeat ourselves slightly when using the module, and we need to make sure that the n argument to wizardServer() is consistent with the pages argument to wizardUi().
This is a principled limitation of the module system which we’ll discuss in more detail in Section 19.5.
Now let’s use the wizard in a slightly more realistic app that has inputs and outputs, and yields Figure 19.6. The main point to notice is that even though the pages are displayed by the module, their ids are controlled by the user of the module. It’s the developer who creates the control who controls its name; it doesn’t matter who ends up assembling the control for final display on the webpage.
page1 <- tagList(
  textInput("name", "What's your name?")
)
page2 <- tagList(
  numericInput("age", "How old are you?", 20)
)
page3 <- tagList(
  "Is this data correct?",
  verbatimTextOutput("info")
)

ui <- fluidPage(
  wizardUI(
    id = "demographics",
    pages = list(page1, page2, page3),
    doneButton = actionButton("done", "Submit")
  )
)
server <- function(input, output, session) {
  wizardServer("demographics", 3)

  observeEvent(input$done, showModal(
    modalDialog("Thank you!", footer = NULL)
  ))

  output$info <- renderText(paste0(
    "Age: ", input$age, "\n",
    "Name: ", input$name, "\n"
  ))
}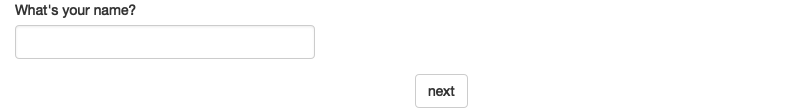
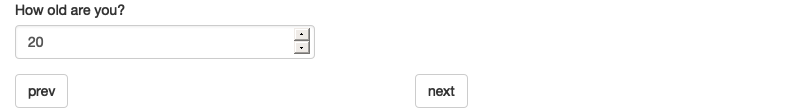
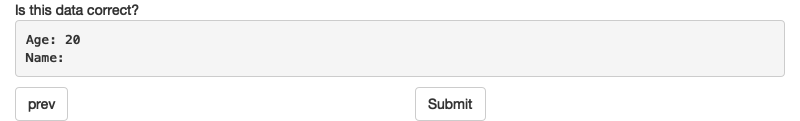
Figure 19.6: A simple, but complete, wizard created with our new module.
19.4.3 Dynamic UI
We’ll finish up with a case study that uses dynamic UI, taking part of the dynamic filtering code found in Section 10.3.3 and turning it into a module. The main challenge of dynamic UI within a module is that because you will be generating UI code within your server function, we need a more precise definition of when explicit namespacing is needed.
As usual, we’ll start with the module UI. It’s very simple here, because we’re just generating a “hole” that the server functions will fill in dynamically.
To create the module server, we’ll first copy in the helper functions from Section 10.3.3: make_ui() makes a control for each column, and filter_var() helps generate the final logical vector.
There’s only one difference here: make_ui() gains an additional id argument so that we can namespace the controls to the module.
library(purrr)

make_ui <- function(x, id, var) {
  if (is.numeric(x)) {
    rng <- range(x, na.rm = TRUE)
    sliderInput(id, var, min = rng[1], max = rng[2], value = rng)
  } else if (is.factor(x)) {
    levs <- levels(x)
    selectInput(id, var, choices = levs, selected = levs, multiple = TRUE)
  } else {
    # Not supported
    NULL
  }
}
filter_var <- function(x, val) {
  if (is.numeric(x)) {
    !is.na(x) & x >= val[1] & x <= val[2]
  } else if (is.factor(x)) {
    x %in% val
  } else {
    # No control, so don't filter
    TRUE
  }
}
Now we create the module server. There are two main parts:
We generate the
controlsusingpurrr::map()andmake_ui(). Note the explicit use ofNS()here. That’s needed because even though we’re inside the module server, the automatic namespacing only applies toinput,output, andsession.We return the logical filtering vector as the module output.
filterServer <- function(id, df) {
  stopifnot(is.reactive(df))

  moduleServer(id, function(input, output, session) {
    vars <- reactive(names(df()))

    output$controls <- renderUI({
      map(vars(), function(var) make_ui(df()[[var]], NS(id, var), var))
    })

    reactive({
      each_var <- map(vars(), function(var) filter_var(df()[[var]], input[[var]]))
      reduce(each_var, `&`)
    })
  })
}
Now we can put it all together in a module app that allows you to select a built-in dataset and then filter on any numeric or categorical variable.
filterApp <- function() {
  ui <- fluidPage(
    sidebarLayout(
      sidebarPanel(
        datasetInput("data", is.data.frame),
        textOutput("n"),
        filterUI("filter"),
      ),
      mainPanel(
        tableOutput("table")
      )
    )
  )
  server <- function(input, output, session) {
    df <- datasetServer("data")
    filter <- filterServer("filter", df)

    output$table <- renderTable(df()[filter(), , drop = FALSE])
    output$n <- renderText(paste0(sum(filter()), " rows"))
  }
  shinyApp(ui, server)
}
A big advantage of using a module here is that it wraps up a bunch of advanced Shiny programming techniques. You can use the filter module without having to understand the dynamic UI and functional programming techniques that make it work.
19.5 Single object modules
To conclude the chapter, I wanted to finish up with a brief discussion of a common reaction to modules. Feel free to skip this section if that wasn’t your reaction. When some people (like me!) encounter modules for the first time, they immediately attempt to combine the module server and module UI into a single module object. To illustrate the problem, let’s generalise the motivating example from the first part of the chapter so that the data frame is now a parameter:
histogramUI <- function(id, df) {
  tagList(
    selectInput(NS(id, "var"), "Variable", names(df)),
    numericInput(NS(id, "bins"), "bins", 10, min = 1),
    plotOutput(NS(id, "hist"))
  )
}

histogramServer <- function(id, df) {
  moduleServer(id, function(input, output, session) {
    data <- reactive(df[[input$var]])
    output$hist <- renderPlot({
      hist(data(), breaks = input$bins, main = input$var)
    }, res = 96)
  })
}
And that leads to the following app:
ui <- fluidPage(
  tabsetPanel(
    tabPanel("mtcars", histogramUI("mtcars", mtcars)),
    tabPanel("iris", histogramUI("iris", iris))
  )
)
server <- function(input, output, session) {
  histogramServer("mtcars", mtcars)
  histogramServer("iris", iris)
}
It seems undesirable that we have to repeat both the ID and the name of the dataset in both the UI and server, so it’s natural to want to wrap into a single function that returns both the UI and the server:
histogramApp <- function(id, df) {
  list(
    ui = histogramUI(id, df),
    server = histogramServer(id, df)
  )
}
Then we define the module outside of the UI and server, extracting elements from the list as needed:
hist1 <- histogramApp("mtcars", mtcars)
hist2 <- histogramApp("iris", iris)

ui <- fluidPage(
  tabsetPanel(
    tabPanel("mtcars", hist1$ui()),
    tabPanel("iris", hist2$ui())
  )
)
server <- function(input, output, session) {
  hist1$server()
  hist2$server()
}
There are two problems with this code.
Firstly, it doesn’t work, because moduleServer() must be called inside a server function.
But imagine that problem didn’t exist or you worked around it some other way.
There’s still a big problem: what if we want to allow the user to select the dataset, i.e. we want to make the df argument reactive.
That can’t work because the module is instantiated before the server function, i.e. before we know that information.
In Shiny, UI and server are inherently disconnected; Shiny doesn’t know which UI invocation belongs to which server session.
You can see this pattern throughout Shiny: for example, plotOutput() and renderPlot() are connected only by shared ID.
Writing modules as separate functions reflects that reality: they’re distinct functions that are not connected other than through a shared ID.
19.6 Summary
This chapter has shown you how to use Shiny modules, a generalisation of functions that allow you to extract coordinated UI and server code into reusable components. It takes a while to get your head around modules, but once you do you’ll have an unlocked a powerful technique for simplifying complex apps.
In the next chapter, you’ll learn how to structure your Shiny app like a package so that you can take advantage of the testing tools available to R packages.